“Longer term: still weeks away from a proper bullish environment.”
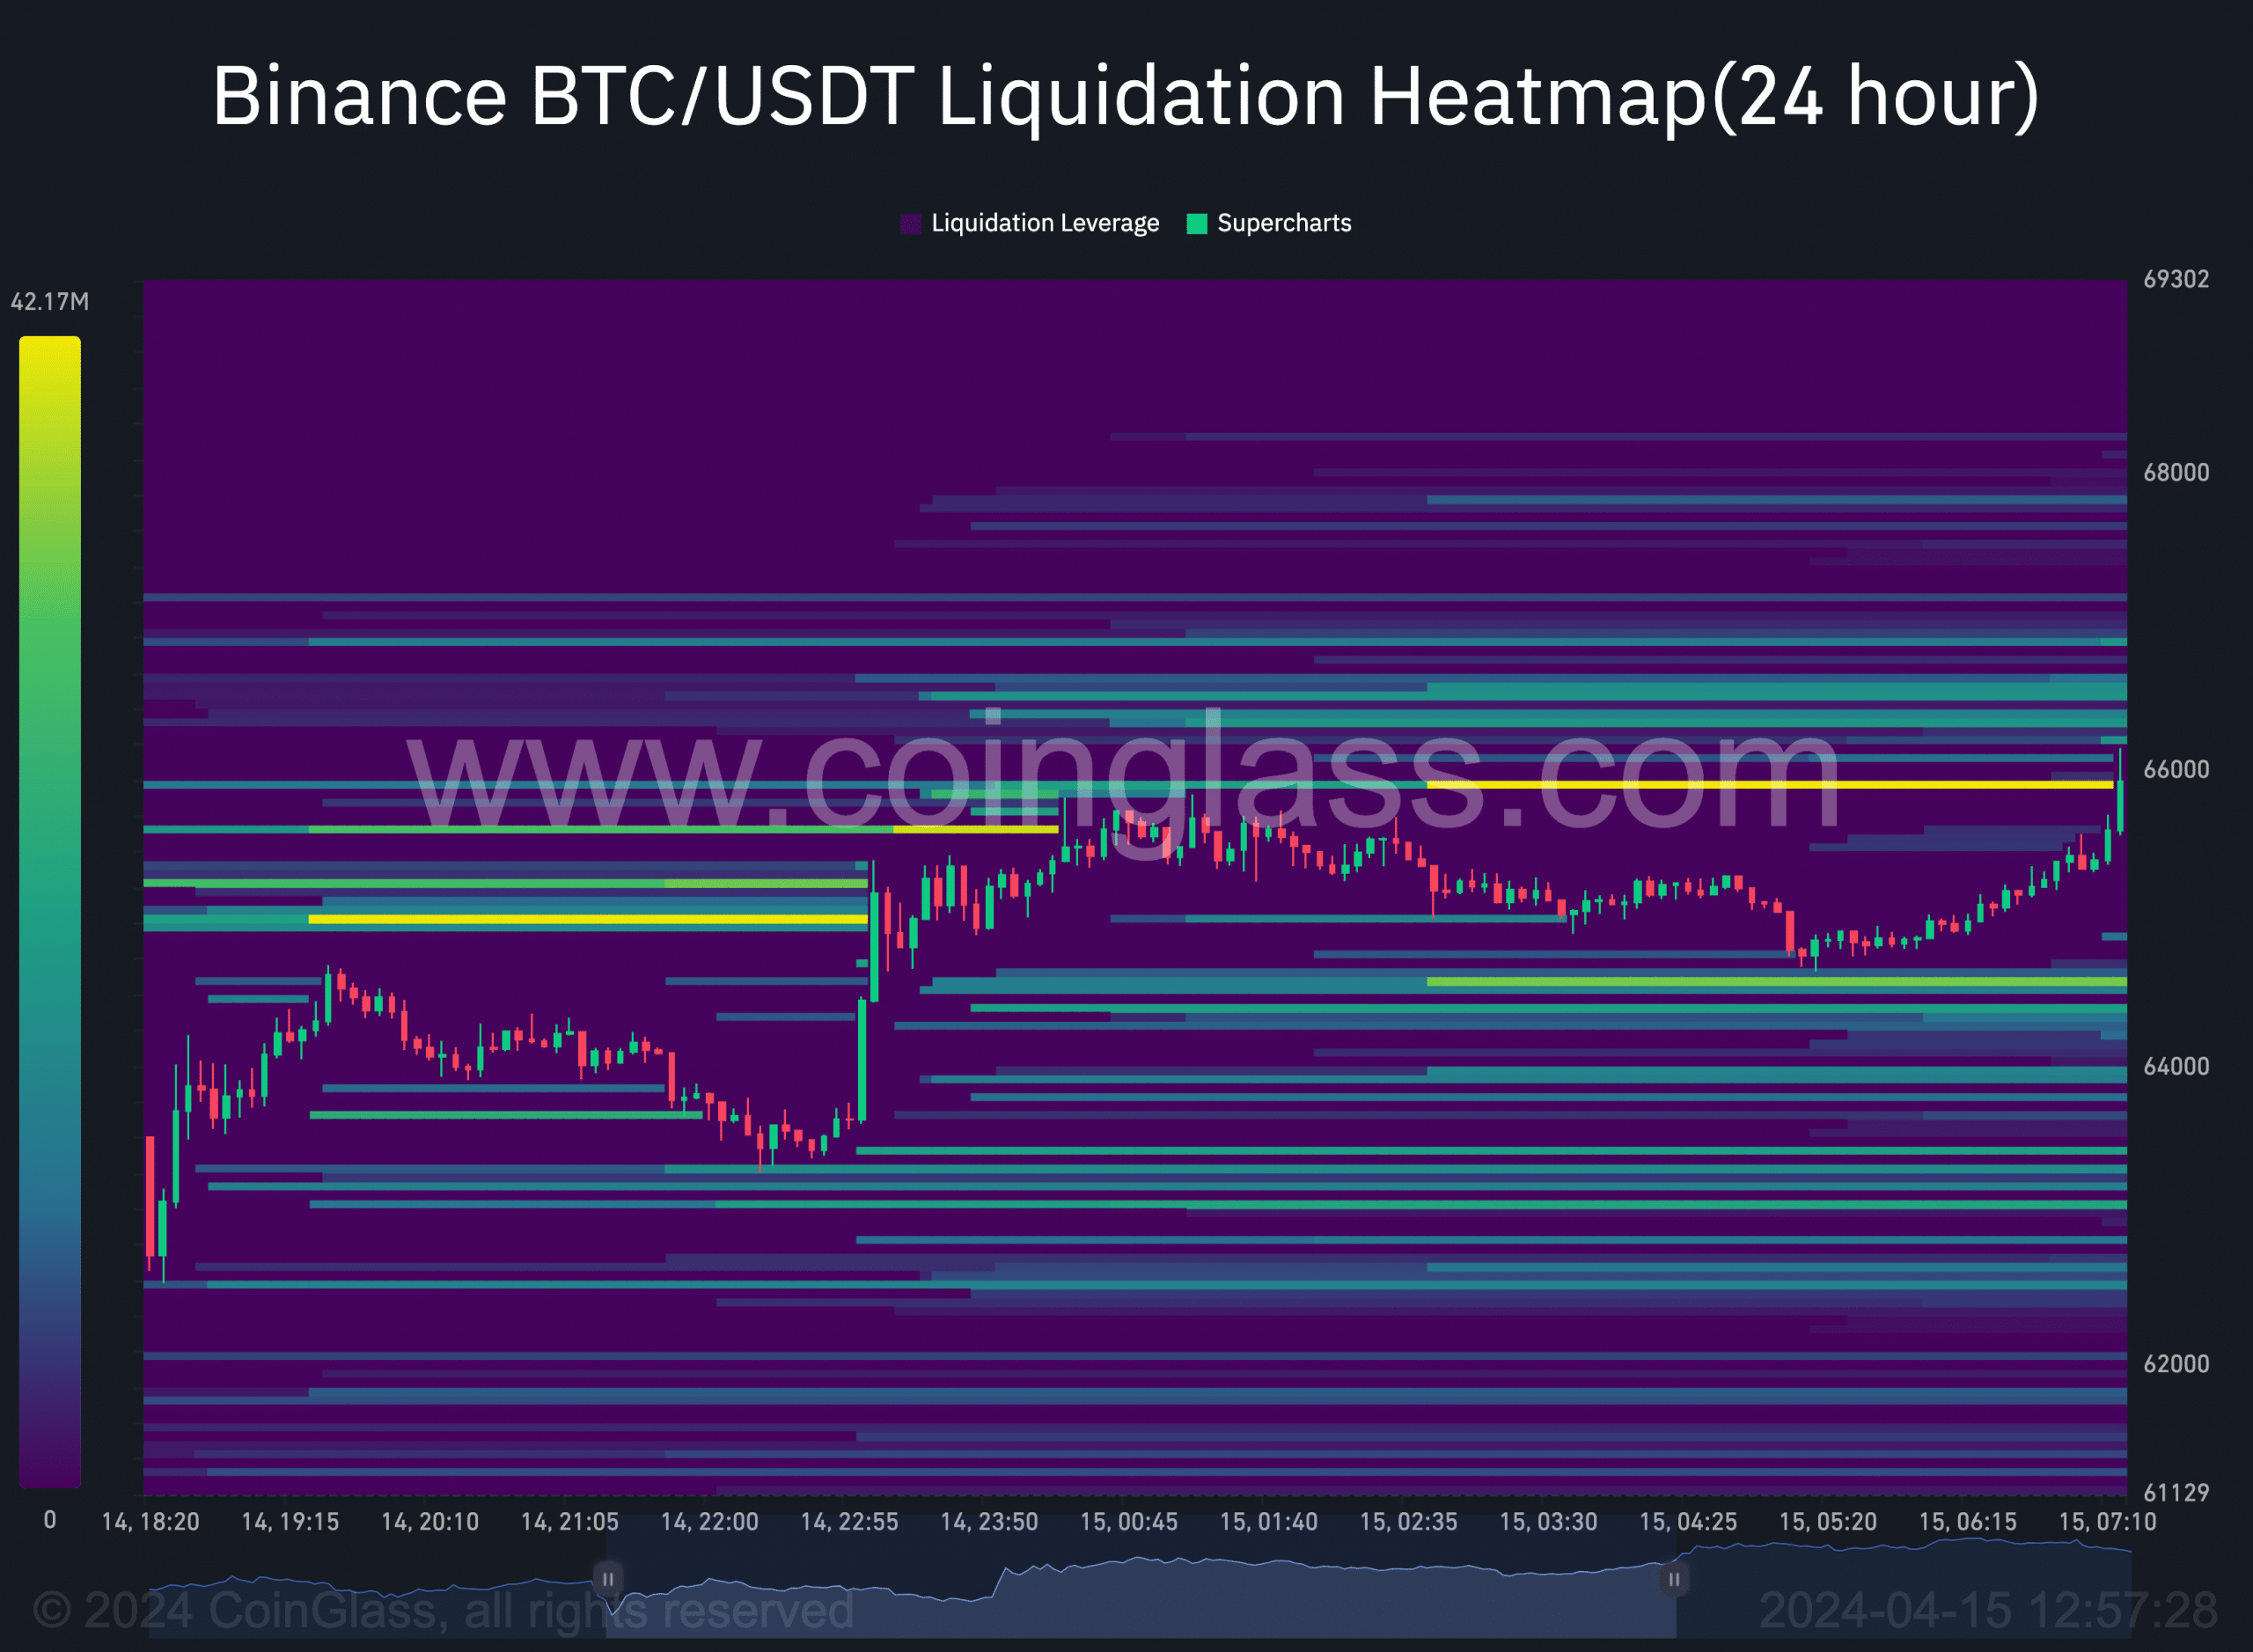
AMBCrypto evaluated the analyst’s prediction by looking at the liquidation heatmap. This heatmap predicts where large-scale liquidations can occur.
As such, traders can identify areas of high liquidity, resistance, and support zones. A high concentration of liquidity is called a magnetic zone.
At this point, the liquidity heatmap highlights a color change, suggesting that the price might move toward the point.
At press time, the metric showed that Bitcoin might move toward $66,638. Here, $7.18 million worth of contracts might be liquidated.
However, if BTC drops, the next area of interest would be $64,580. At this point, open positions worth $29.17 million could be wiped out on Binance alone.


Source: Coinglass
In a nutshell, Bitcoin needs to flush out long leverage positions down to $60,000 to confirm this bear phase. If this does not happen, the price of the coin might rise between $72,000 and $75,000.
Stay calm, BTC’s decline is not end
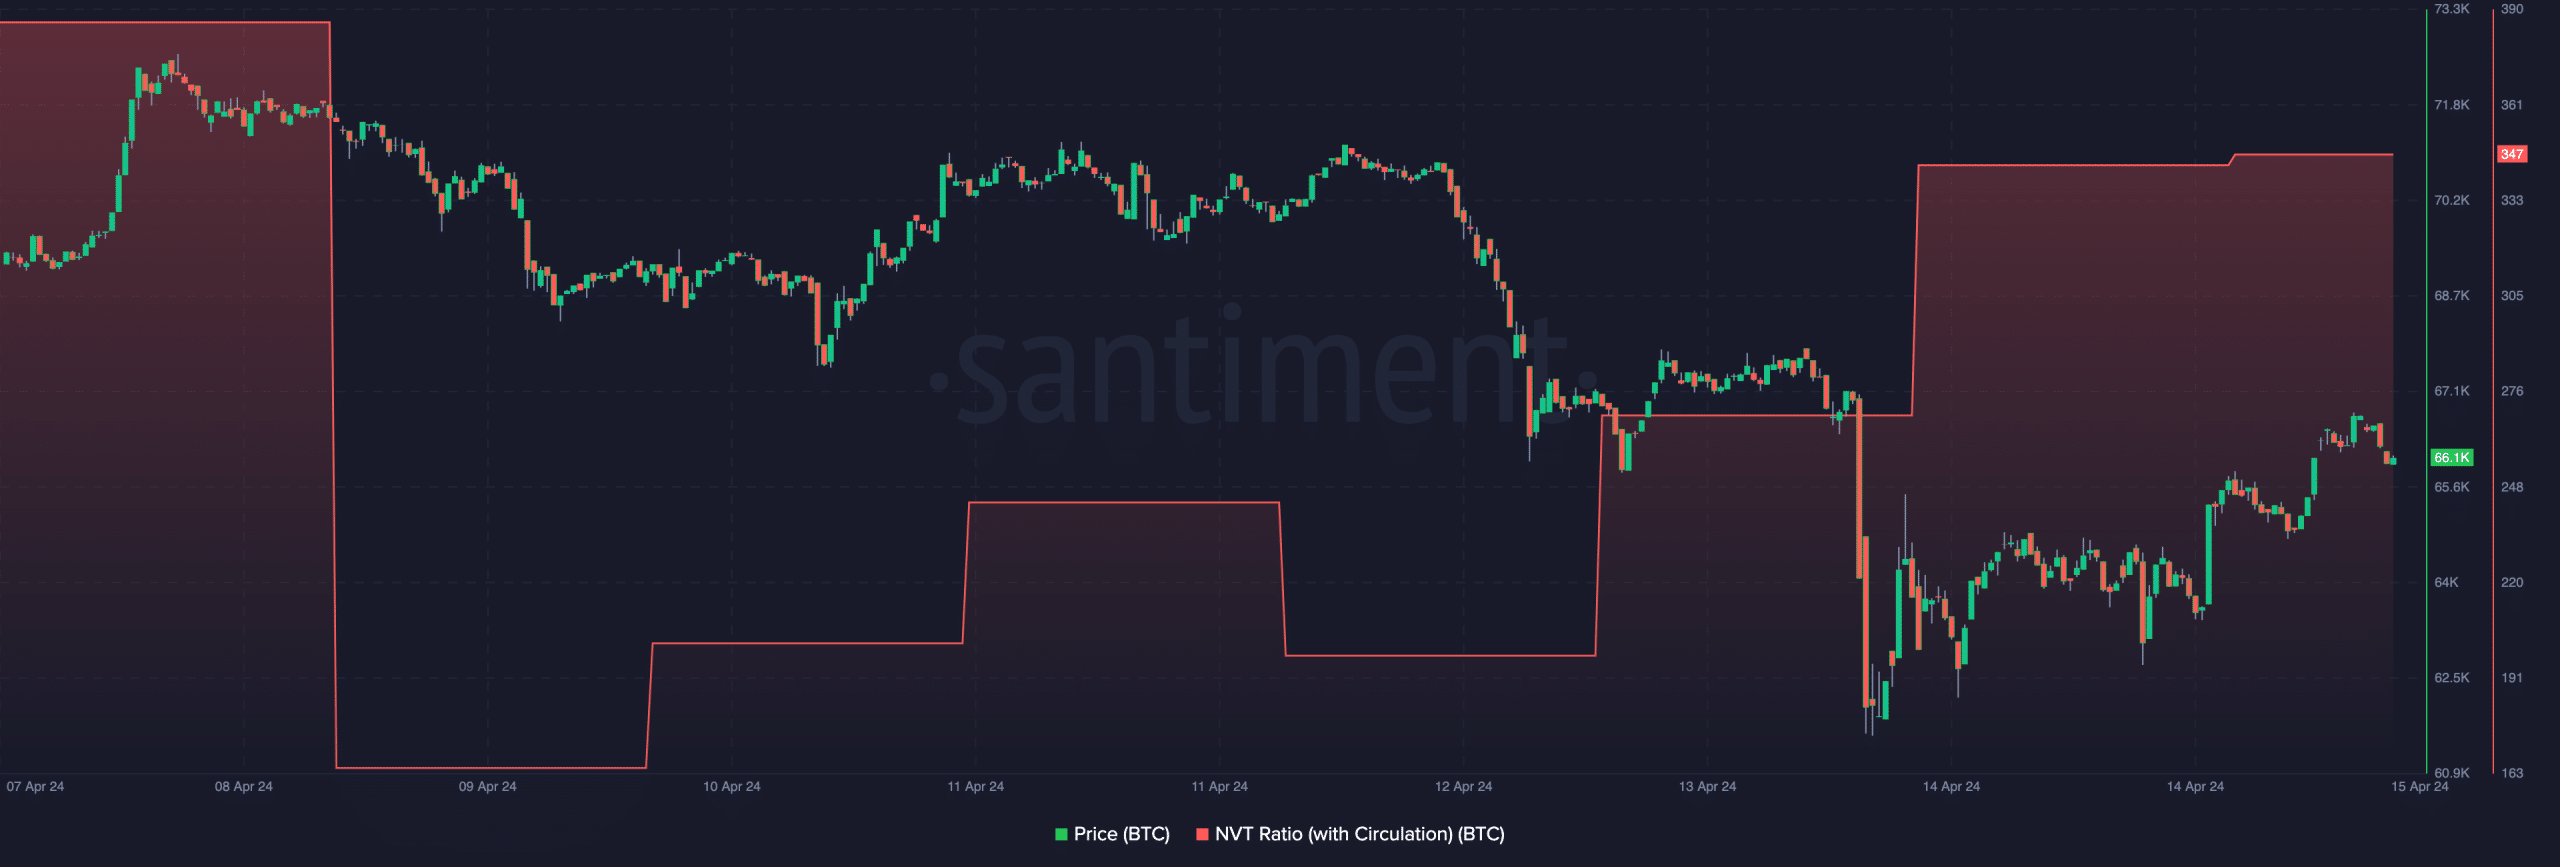
Though BTC flashed bullish tendencies, the Network Value to Transactions (NVT) ratio showed that the analyst might have a point.
For context, the NVT ratio indicates whether a cryptocurrency is overvalued or not. If the metric spikes, it means that the cryptocurrency might be overvalued relative to the transactions.
However, a low NVT ratio means the network is undervalued, and prices can move higher in the short term.
As of this writing, Bitcoin’s NVT ratio moved higher, suggesting that the price could be overvalued for the current market condition.


Source: Santiment
Should the reading remain high over the coming days, Bitcoin’s price might undergo another correction. However, Woo shared his long-term Bitcoin forecast hours after his initial post.
Is your portfolio green? Check out the BTC Profit Calculator
According to him, the coin might hit $91k this cycle and $650k in the years to come. He concluded,


