Since the Bitcoin price started correcting from $70K to $66K a week ago, then $65K to the current price of $61,172, the overall momentum has faded. Despite this, some altcoins this week have been resilient to the trend and made notable profits.
This mid-volatile environment has historically proven to be a point for potential altcoins to make spikes, some flip zeros, and some surpass the marketcap.
Here are the Top 4 Cryptocurrencies that are on the verge of breaking out of a crucial resistance.
Kaspa (KAS): Breakout with curve correction
Kaspa KAS at press time trading at $0.1761 has moved 8.9% in 24 hours with a massive volume spike of 200%. KAS price is bullish about the price trading above all moving averages and the technical indicators stand at neutral to buy signal.
Moreover, the KAS/USDT chart retested a resistance at $0.1780 and now plots the possibility of the cup and handle pattern in formation with a few more trading sessions. If this is completed, a breakout towards the resistance of $0.19 is expected, further making a rally into the $2 zone.
Kendu Inu ( KENDU) :
Kendu Inu, KENDU at press time trading at $0.000172, this Ethereum-based meme coin has grown 280% in a month frame. Though the project doesn’t represent any use case, no historical data the KENDU has made a significant impact on the meme coin market.
The altcoin last week touched ATH and holds the potential to break above the $0.0002 level.
The KENDU/USDT Chart shows Bollinger bands with price away from the center line, showing a bullish signal in an upward direction. Also, the closer bandwidth shows an increasing volatility. RSI at 57 indicates, the price making room for an upward direction without being overbought.
If the trend continues, KENDU may hit $0.0002 and rally furthers.
Aave , AAVE
Aave, AAVE at the time of writing is $95.34 with a 4.53% surge in 24 hours. Aave’s performance since the mid of May has been impressive, but it couldn’t sustain to continue In June.
June has been a downtrend for Aave but in the last 7 Days, the altcoin has added power to gain 8.8% in 7 days and constantly making upward price action.
The AAVE/USDT Chart reveals price trading near horizontal and vertical resistance, and a breakout from this level is possible as the RSI is still at 57 with upward momentum.
Additionally, the increase in DAU ( Daily active addresses), TVL, and other on-chain metrics was seen in the last 15 days. Any invalidation from the above resistance point here will draw the bulls toward the strong support zone, if validated the next price target is $102, $104, $109, and $115.
Jasmy Coin, JASMY
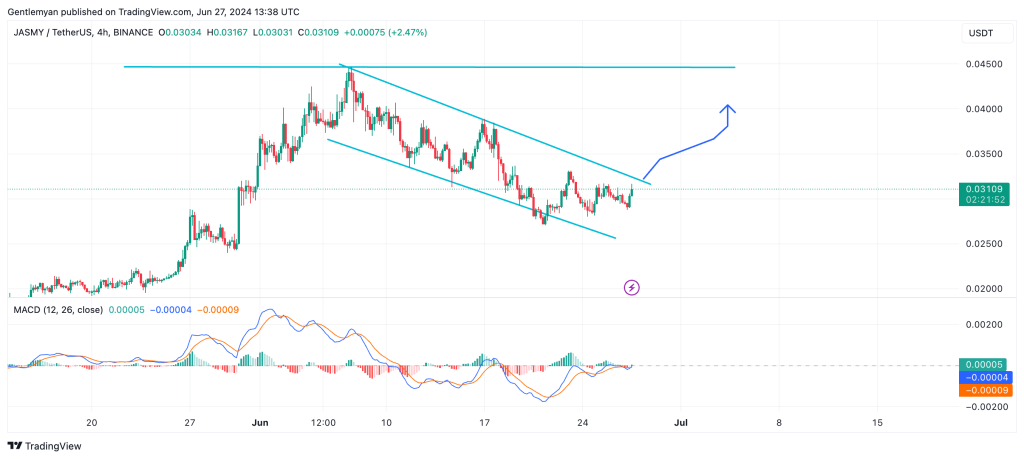
JASMY, currently changing hands at $0.0313 has moved 4.8% up in 24 hours and entered a recovery zone price trying to breach the EMA20 trend line. JasmyCoin started the month with a spike to a year-high of $0.044, but couldn’t sustain above that level, resulting in a bearish trend from the past 3 days.
The JASMY/USDT Chart represents a potential breakout as the price trading in the falling channel with a downward resistance line. If the price breaches this line, it will hover in the $0.02 zone with further rally.

MACD is intact with the signal line holding up the rally, if the blue line manages to come above the red line, the above breakout picture will be seen in the fee trading session.


