Having failed to break its previous high for the year, the price of Solana has continued to move downward. From the height of $118.88, the coin, which is currently ranked 5th in the crypto space with a total supply of 440,961,455 SOL and a market capitalization of $58.2 million, has made a drop of over 25% and is not showing any signs of stopping.
As of the time of writing, the price of SOL was up by 2.76% and trading around $102.63, below the 100-day moving average in the last 24 hours. Meanwhile, in the daily timeframe, the price has dropped a bearish candlestick, indicating that the price is still bearish.
The moving average indicator generally is used to determine the trend of an asset, which could be an uptrend or downtrend. Since the price of Solana is trading below the 100-day moving average, could this mean that the price has changed from an uptrend to a downtrend?
Solana On The 4-Hour Chart
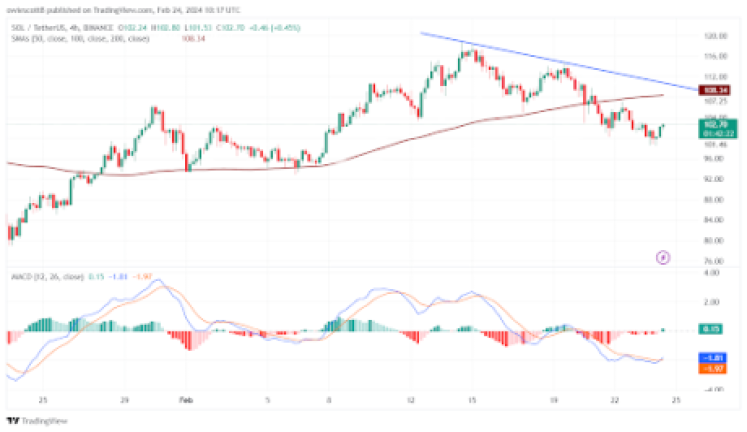
A technical examination of the chart from the 4-hour timeframe and with the help of a trend line we can see that two resistance levels of $118.88 and $114.87 have been created by previous price movement. We can also see that the price has broken the support level of $103.57. Therefore, the price for the next destination might be the $92.84 support level.
This can be seen in the image below:

Source: Tradingview.com
Also, taking a look at the 4-hour timeframe chart with the help of the MACD indicator in the above image, we can see that the MACD histogram is trending below the MACD zero line. Both the MACD line and the signal line have crossed and are trending below the MACD zero line, suggesting that the price of SOL is bearish and could continue to move downward.
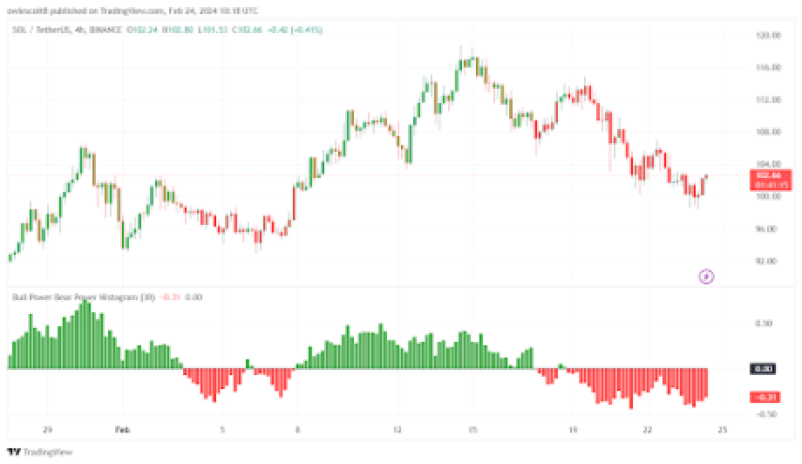
A final look at the chart with the help of the Bull Power Vs. Bear Power Histogram indicator, we can see that the histograms are trending below the zero line. This suggests that buyers have completely lost momentum in the market, and sellers have taken over it. Thus, the price will tend to move downward.
We can see this in the image below:

Source: Tradingview.com
Possible Outcomes If The SOL Price Continues To Drop
If SOL continues to drop, we might see the price moving toward the support level of $92.84. Also, if it manages to break below this level, the price might move further downward toward the $79.32 support level.
Presently, Solana is seeing minor upsides of 1.3% in the last 24 hours, according to data from CoinMarketCap.
SOL bulls struggle to maintain price at $102 | Source: SOLUSD on Tradingview.com
Featured image from Coinfomania, charts from Tradingview.com
Disclaimer: The article is provided for educational purposes only. It does not represent the opinions of NewsBTC on whether to buy, sell or hold any investments and naturally investing carries risks. You are advised to conduct your own research before making any investment decisions. Use information provided on this website entirely at your own risk.


