With the Bitcoin price falling back to the $65K mark, investors are turning their heads to meme coins. However, the price of many top meme coins fell sharply with the market-wide sell-off, warning of a bearish week.
Amidst the plethora of community-driven coins, the MEME price trend shows a trend reversal opportunity in the daily chart. With a breakout rally teasing a sharp upside move, will the buyers surpass the psychological mark of $0.050?


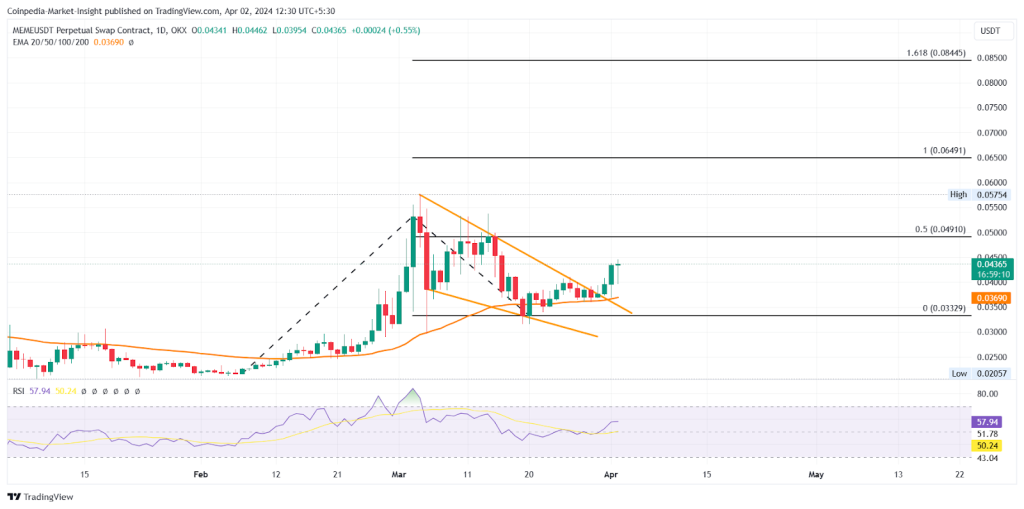
Following the 139% in just 25 days, the MEME price shoots up to the $0.05319 mark by 4th March. However, the bullish trend exhausts quickly leading to a sharp pullback for the entire month, leading to a 37% drop to $0.03329.
During the pullback, the altcoin led to a bearish pattern in the daily chart, contracting the trend momentum. However, the recent bounce back from $0.03329 leads to a bullish breakout of the bearish pattern.
With an 18% jump in the last three days, the MEME price trades at $0.04365, with a long-tail intraday candle. As the released trend momentum teases a bull run continuation, the sideline traders could find this as an excellent entry spot.
Read More : Memecoin Bloodbath Continues! Dogecoin To Retest It’s Low Of $0.15?
Will MEME Price Surpass $0.050?
According to the trend-based Fibonacci levels, the recent bounce back in the MEME price might shortly challenge the psychological barrier of $0.050. This will mark a pivotal stage in the MEME token.
With the rising trend momentum and the breakout event, the chances of buyers succeeding at a $0.050 breakout are greater. Further, with the bullish break, the uptrend could reach the 1.618% Fib level at $0.08445 but could find resistance at $0.06491.
Also Check Out : BOME Price Revives Uptrend With 65% Upside Potential


