- A key indicator suggested that Ethereum might touch $5k in the coming months
- Nonetheless, a few of the other market indicators turned bearish and flashed red
The hype around Ethereum [ETH] ETFs has been rising lately, with the launch date drawing closer with every passing day. Investors’ expectations of the king of altcoins have also risen, with many expecting the crypto to hit new bullish heights on the back of the Spot ETFs’ launch.
Ethereum ETFs create buzz
It is in this context that IntoTheBlock recently shared a tweet highlighting something very interesting. According to the on-chain analytics platform, $126 million worth of ETH was withdrawn from exchanges this week. This number suggested that investors have been considering accumulating ETH.
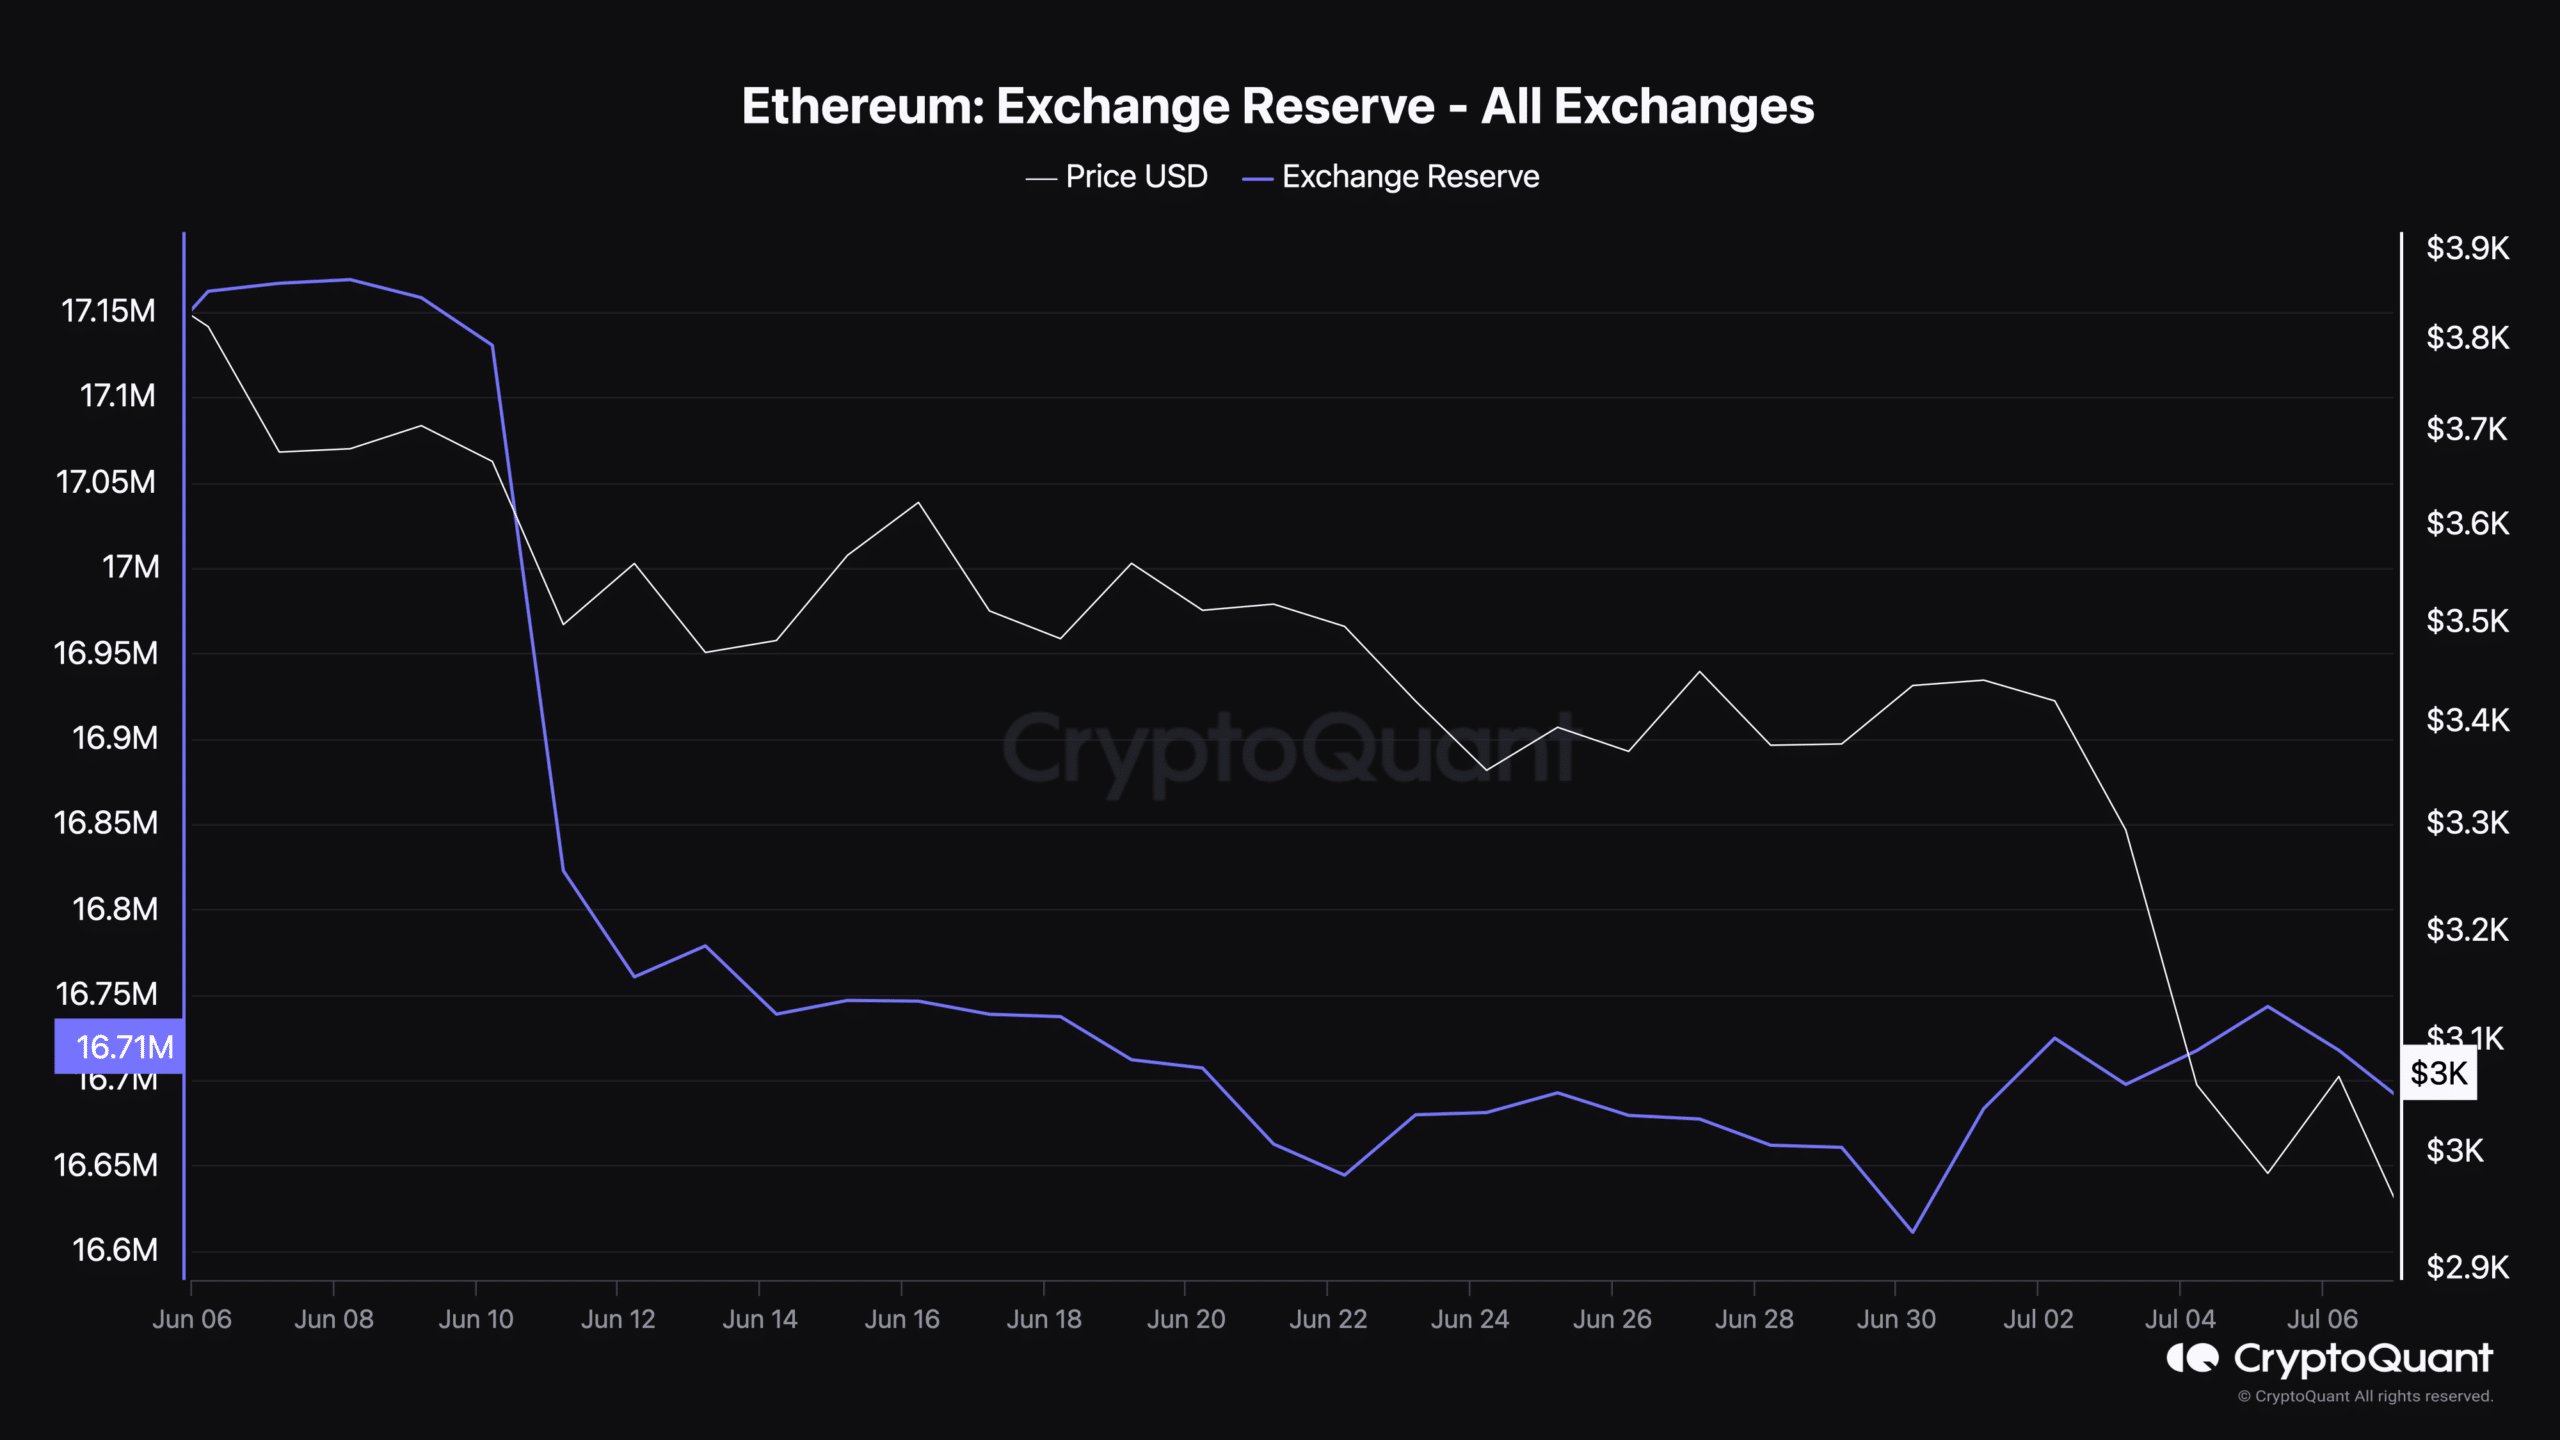
AMBCrypto’s analysis of CryptoQuant’s data also told a similar story. We found that the token’s exchange reserves dropped sharply, reflecting a hike in buying pressure.

Source: CryptoQuant
Notably, this has been happening days before the much-awaited Spot ETH ETF launch. Connecting the dots, investors might be expecting the king of altcoin’s price to skyrocket after the launch.
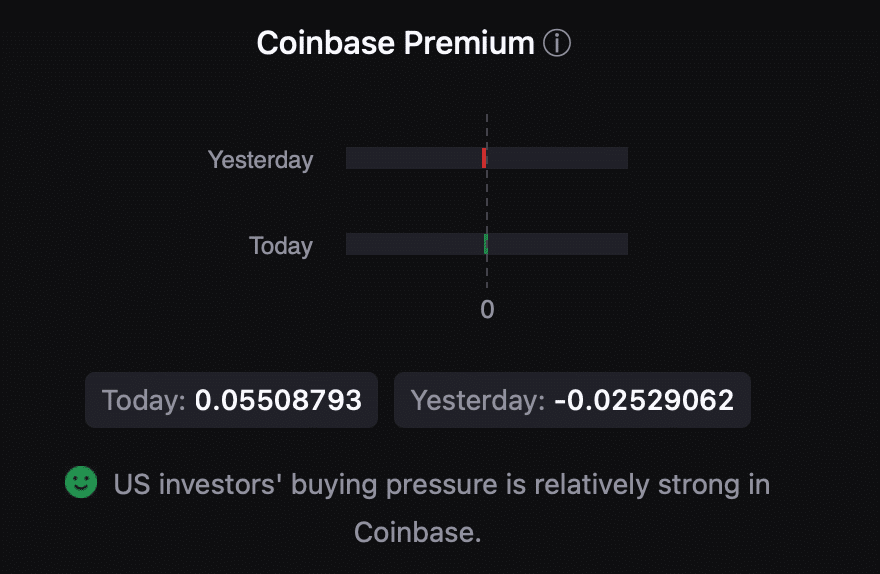
Moreover, ETH’s Coinbase premium was green too, meaning that buying sentiment has been strong among U.S investors.

Source: CryptoQuant
Apart from this, AMBCrypto reported previously that investors have been showing confidence in ETH. ETH’s taker buy/sell ratio, for instance, saw notable spikes above the value of 1 in recent weeks, indicating shifts in market dynamics. Here, a taker buy/sell ratio above 1 is a strong indicator of aggressive purchasing by bulls.
We then took a look at Glassnode’s data to find out where Ethereum might go if this bull rally continues.
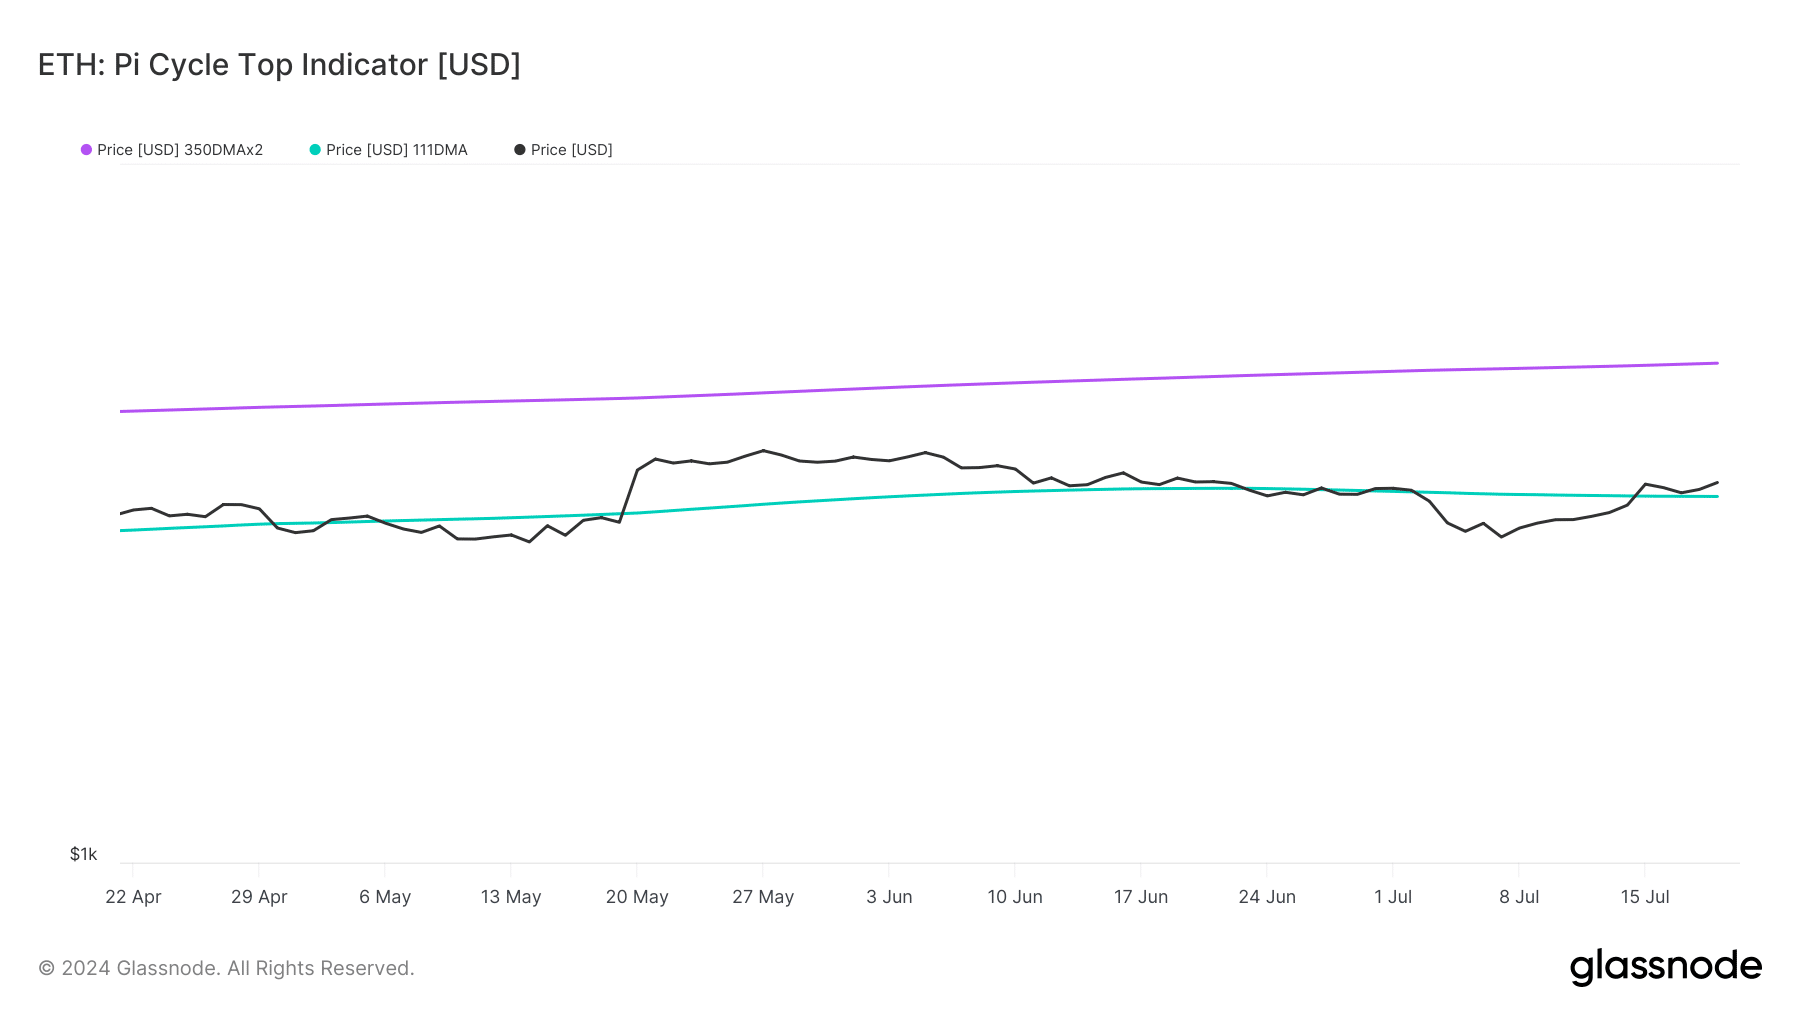
According to the Pi Cycle Top indicator, ETH’s price has started to move above its possible market bottom. If the indicator is to be believed, then ETH might touch $5k in the coming months.

Source: Glassnode
Is a further uptrend likely?
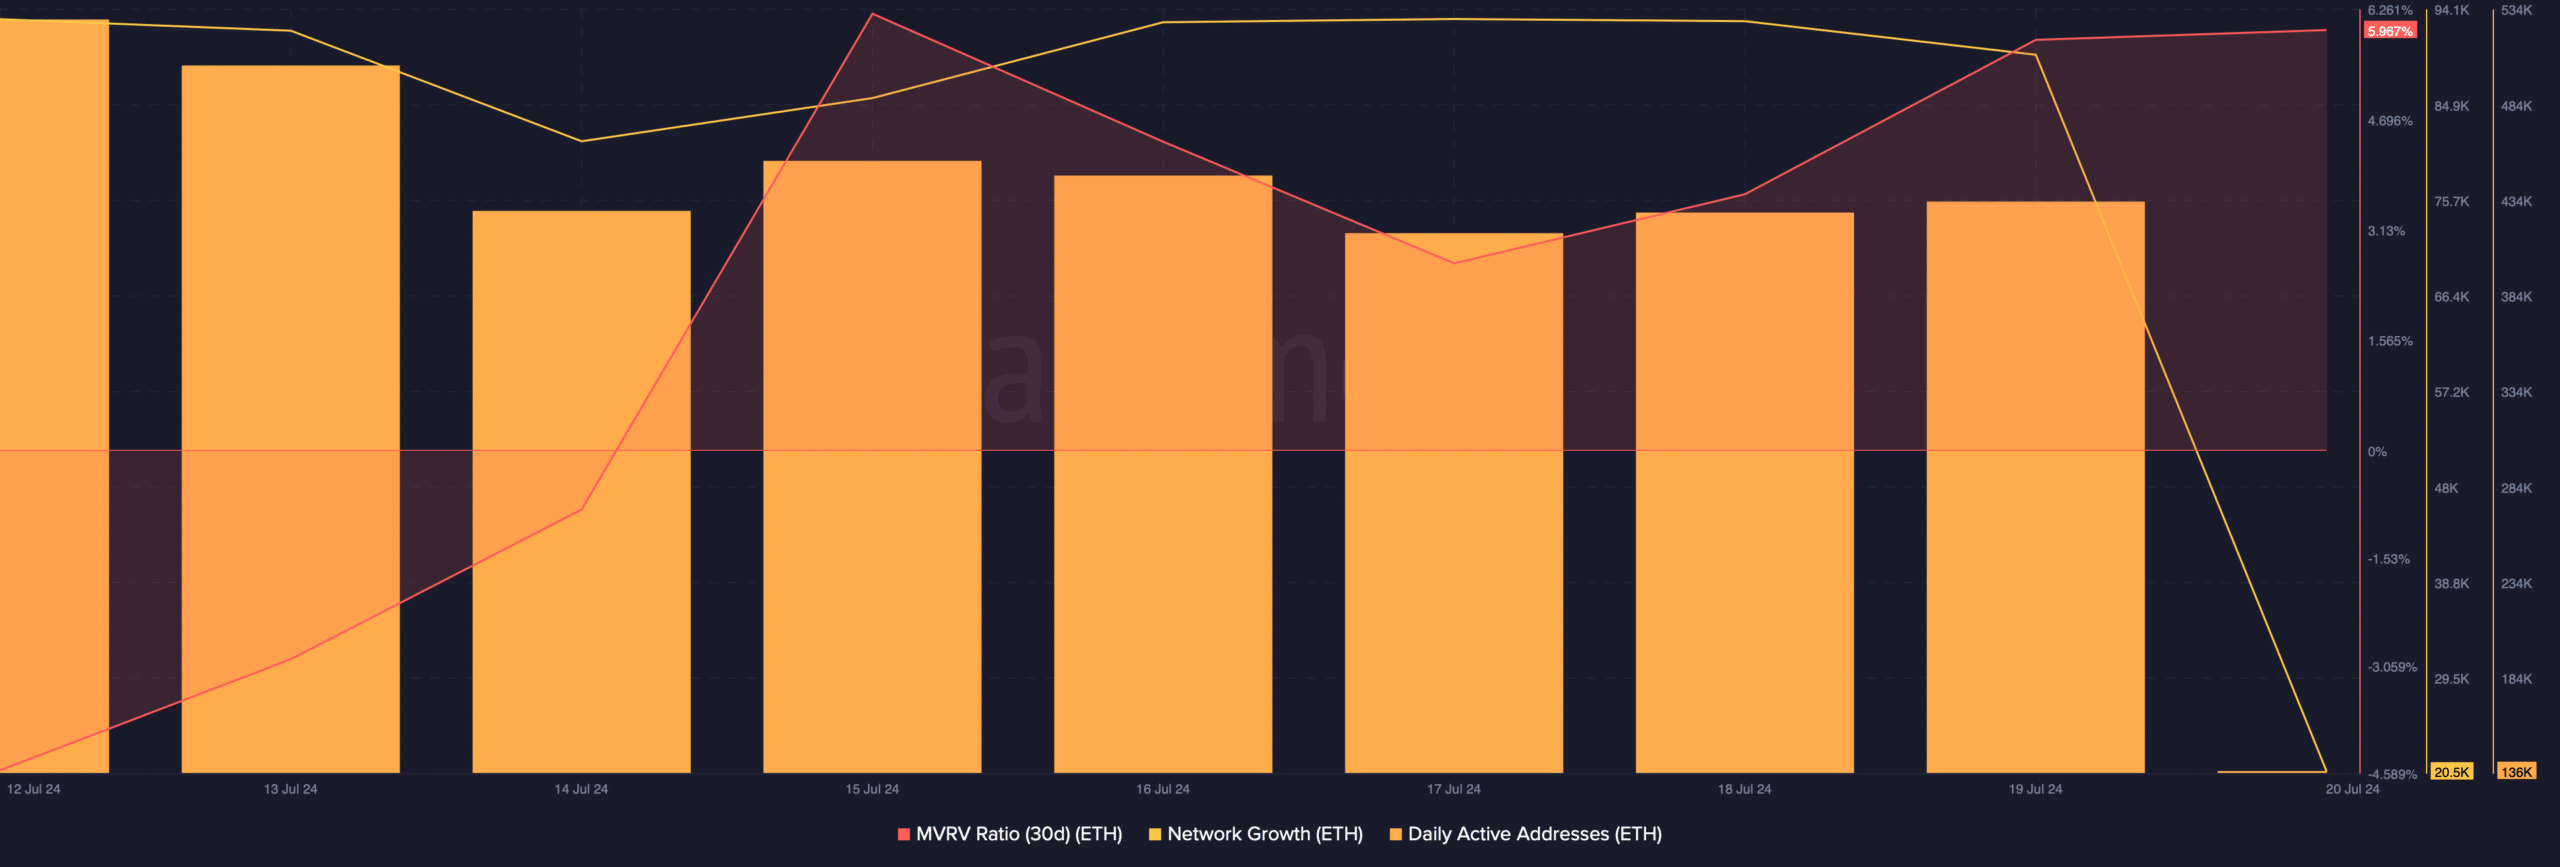
AMBCrypto then assessed Santiment’s data to find out whether the road to $5k is something to expect in the short term. We found that its MVRV ratio rose sharply, which can be inferred as a bullish signal.
At press time, Ethereum’s MVRV ratio had a value of over 5.97%. Ethereum’s network growth was also high, indicating that more addresses were created to transfer the token. Additionally, its daily active address remained stable last week, reflecting robust network activity.

Source: Santiment
Finally, the technical indicator MACD displayed a clear bullish advantage in the market. However, at the time of writing, ETH was testing a crucial resistance. It’s imperative for ETH to break above that level in order to sustain its bull rally.
The Money Flow Index (MFI) was in the overbought zone and can exert selling pressure in the short-term.
Read Ethereum’s [ETH] Price Prediction 2024-25
Additionally, the Chaikin Money Flow (CMF) also registered a downtick.
Taken together, these indicators suggested that ETH might take more time to climb above its resistance level on the charts.
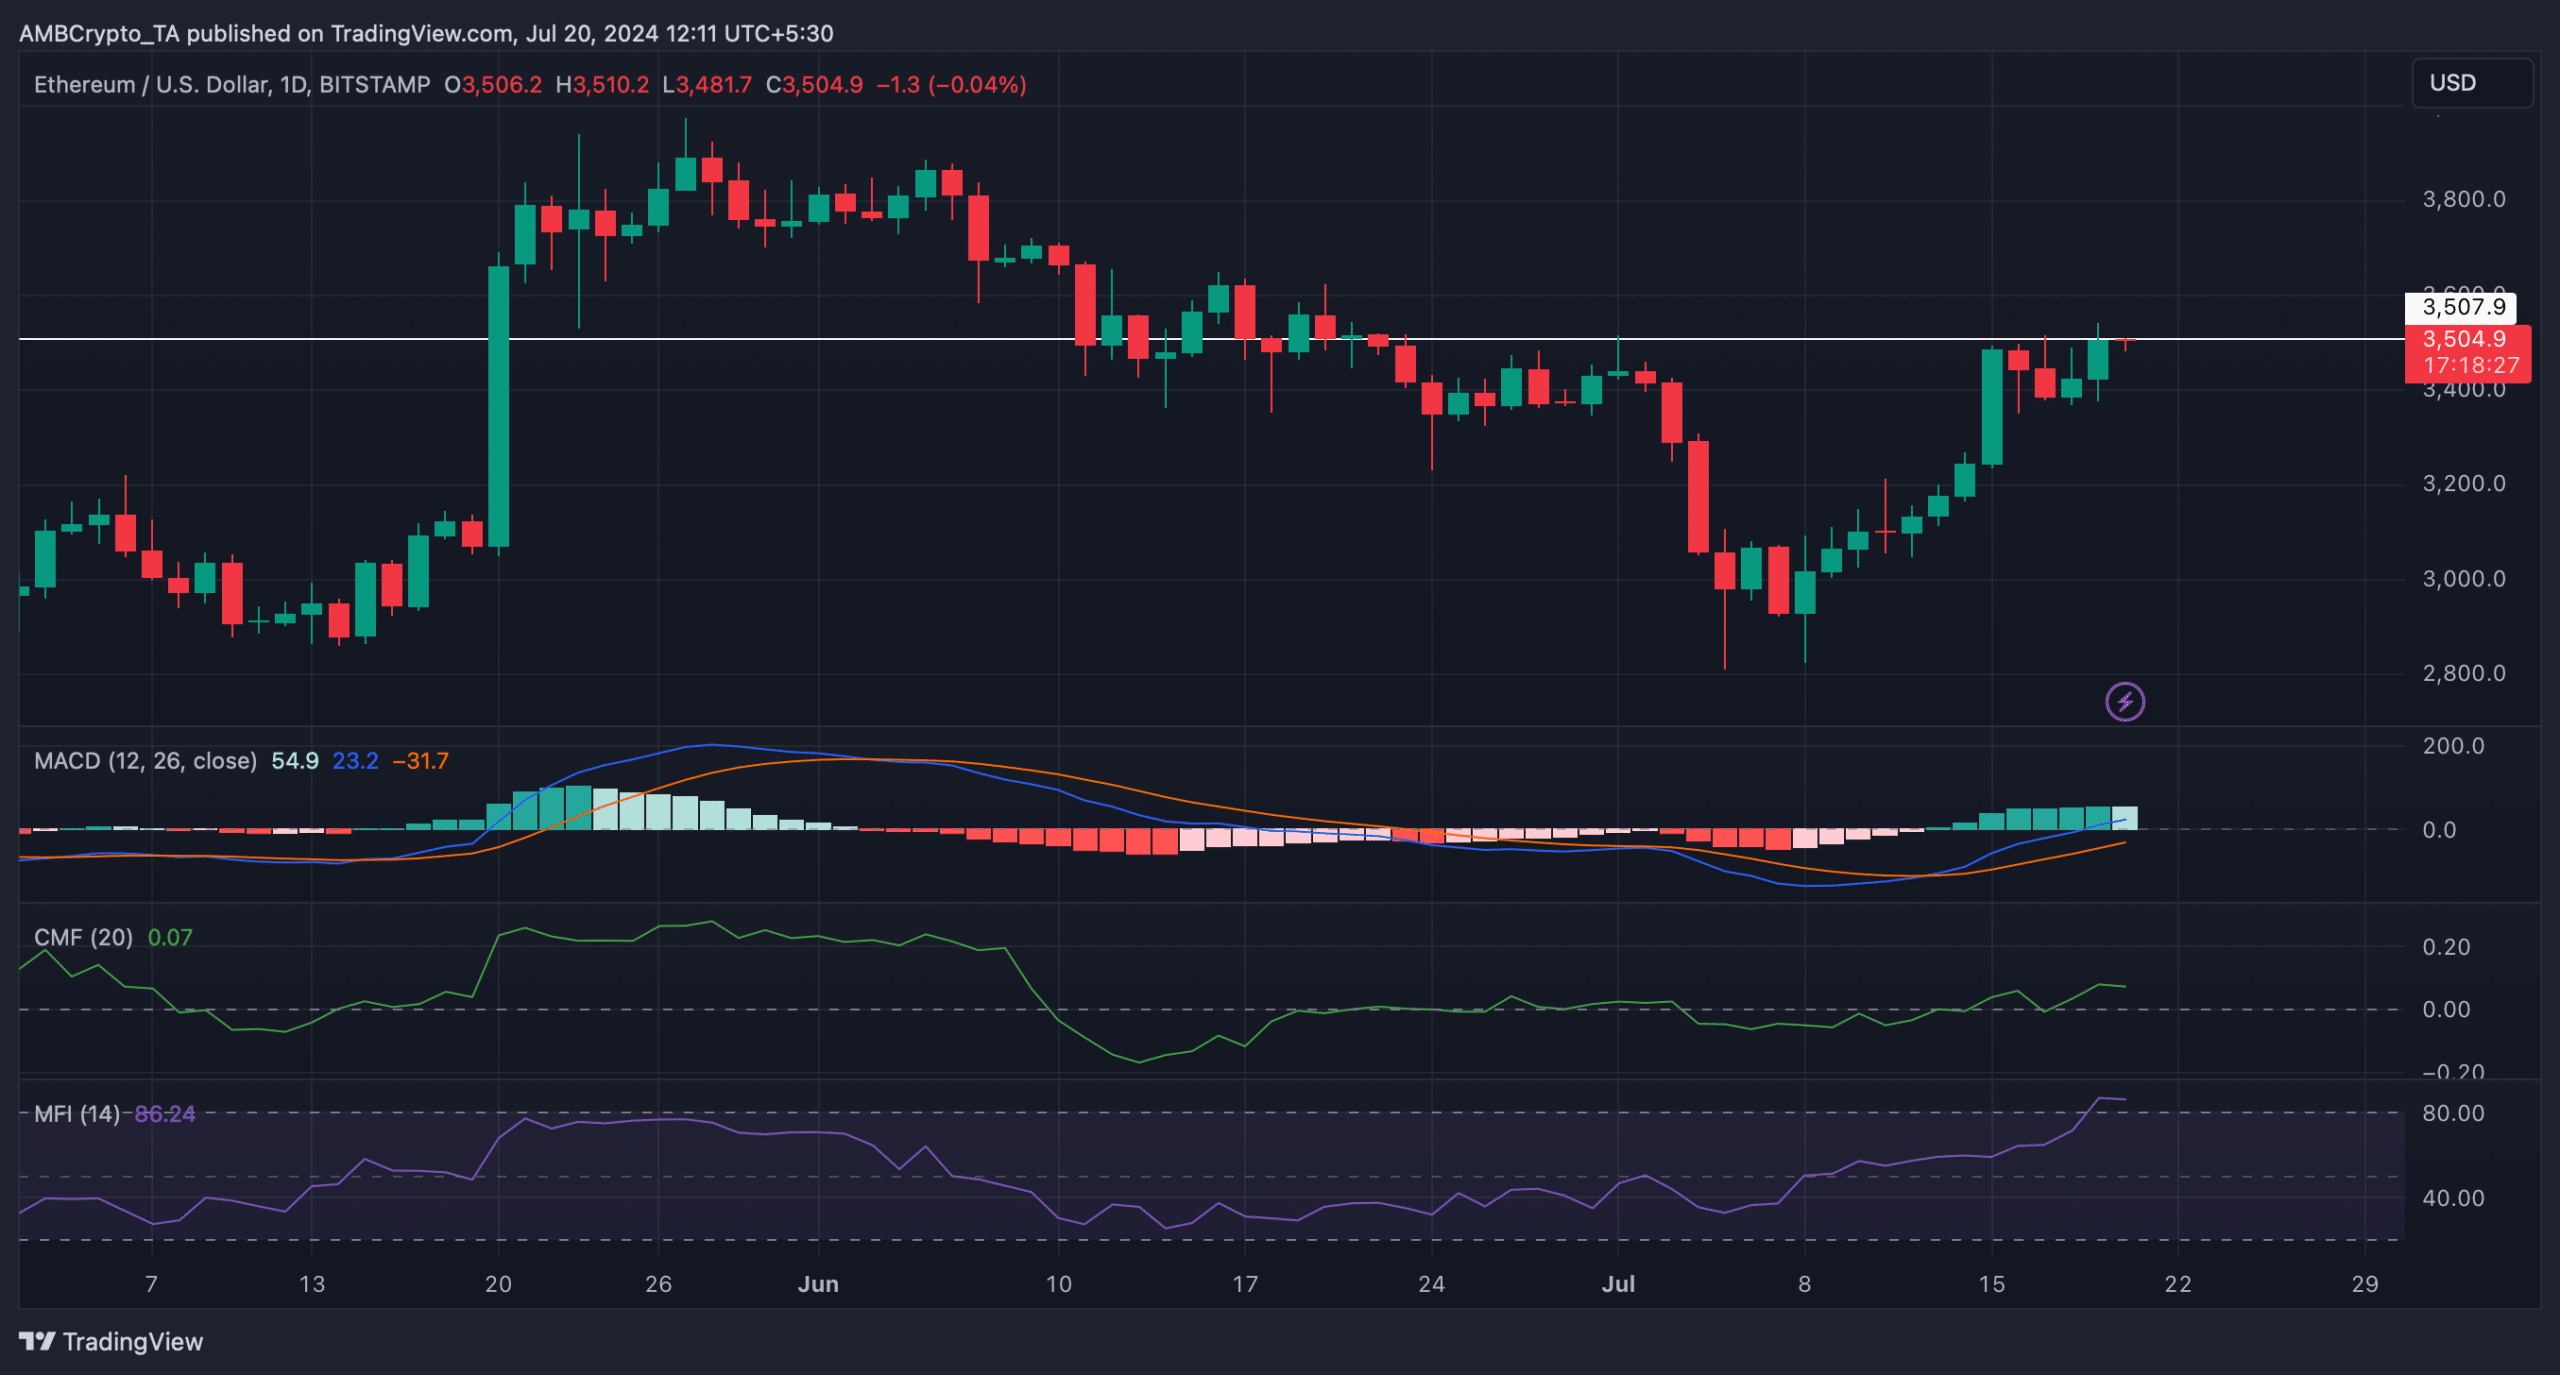

Source: TradingView


