- ONDO, TON, and FTM had the week’s biggest gains.
- INJ, JUP, and BONK were the biggest losers for the week.
Last week was marked by a general decline in bullish sentiment in the cryptocurrency market, which impacted the performance of several assets.
During that period, the global cryptocurrency market capitalization fell by 7%. Here’s AMBCrypto’s list of the biggest winners and losers from the 17th to the 24th of March.
Biggest winners
Ondo [ONDO]
Ondo [ONDO], the native token of securities tokenization project Ondo Finance, led the cryptocurrency market as the asset with the most gains in the last week.
Exchanging hands at $0.75 at press time, the token’s value rose by over 57% over the last seven days.
On the 21st of March, ONDO climbed to an all-time high of $0.81. This followed reports that BlackRock had committed another round of capital to launch a tokenized money market fund.
Although ONDO’s price was up almost 10% in the past 24 hours, the double-digit decline in its trading volume within the same period created a divergence that hinted at a possible drawback in the token’s value.
Toncoin [TON]
Per CoinMarketCap’s data, TON saw an impressive weekly rally of 46% to rank as the asset with the second-highest gains last week.
The surge in the token’s price was due to the commencement of the first full season of The Open League, which the Ton Foundation announced on 20th March.
According to the blog post, the program will allow TON-based projects to compete for rewards, and the network’s users will receive rewards for their on-chain activity.
Through this event, 30 million TON worth around $115 million will be distributed to ecosystem members.
As of this writing, the altcoin exchanged hands at $5.10, with a 109% uptick in its trading volume in the past 24 hours.
Fantom [FTM]
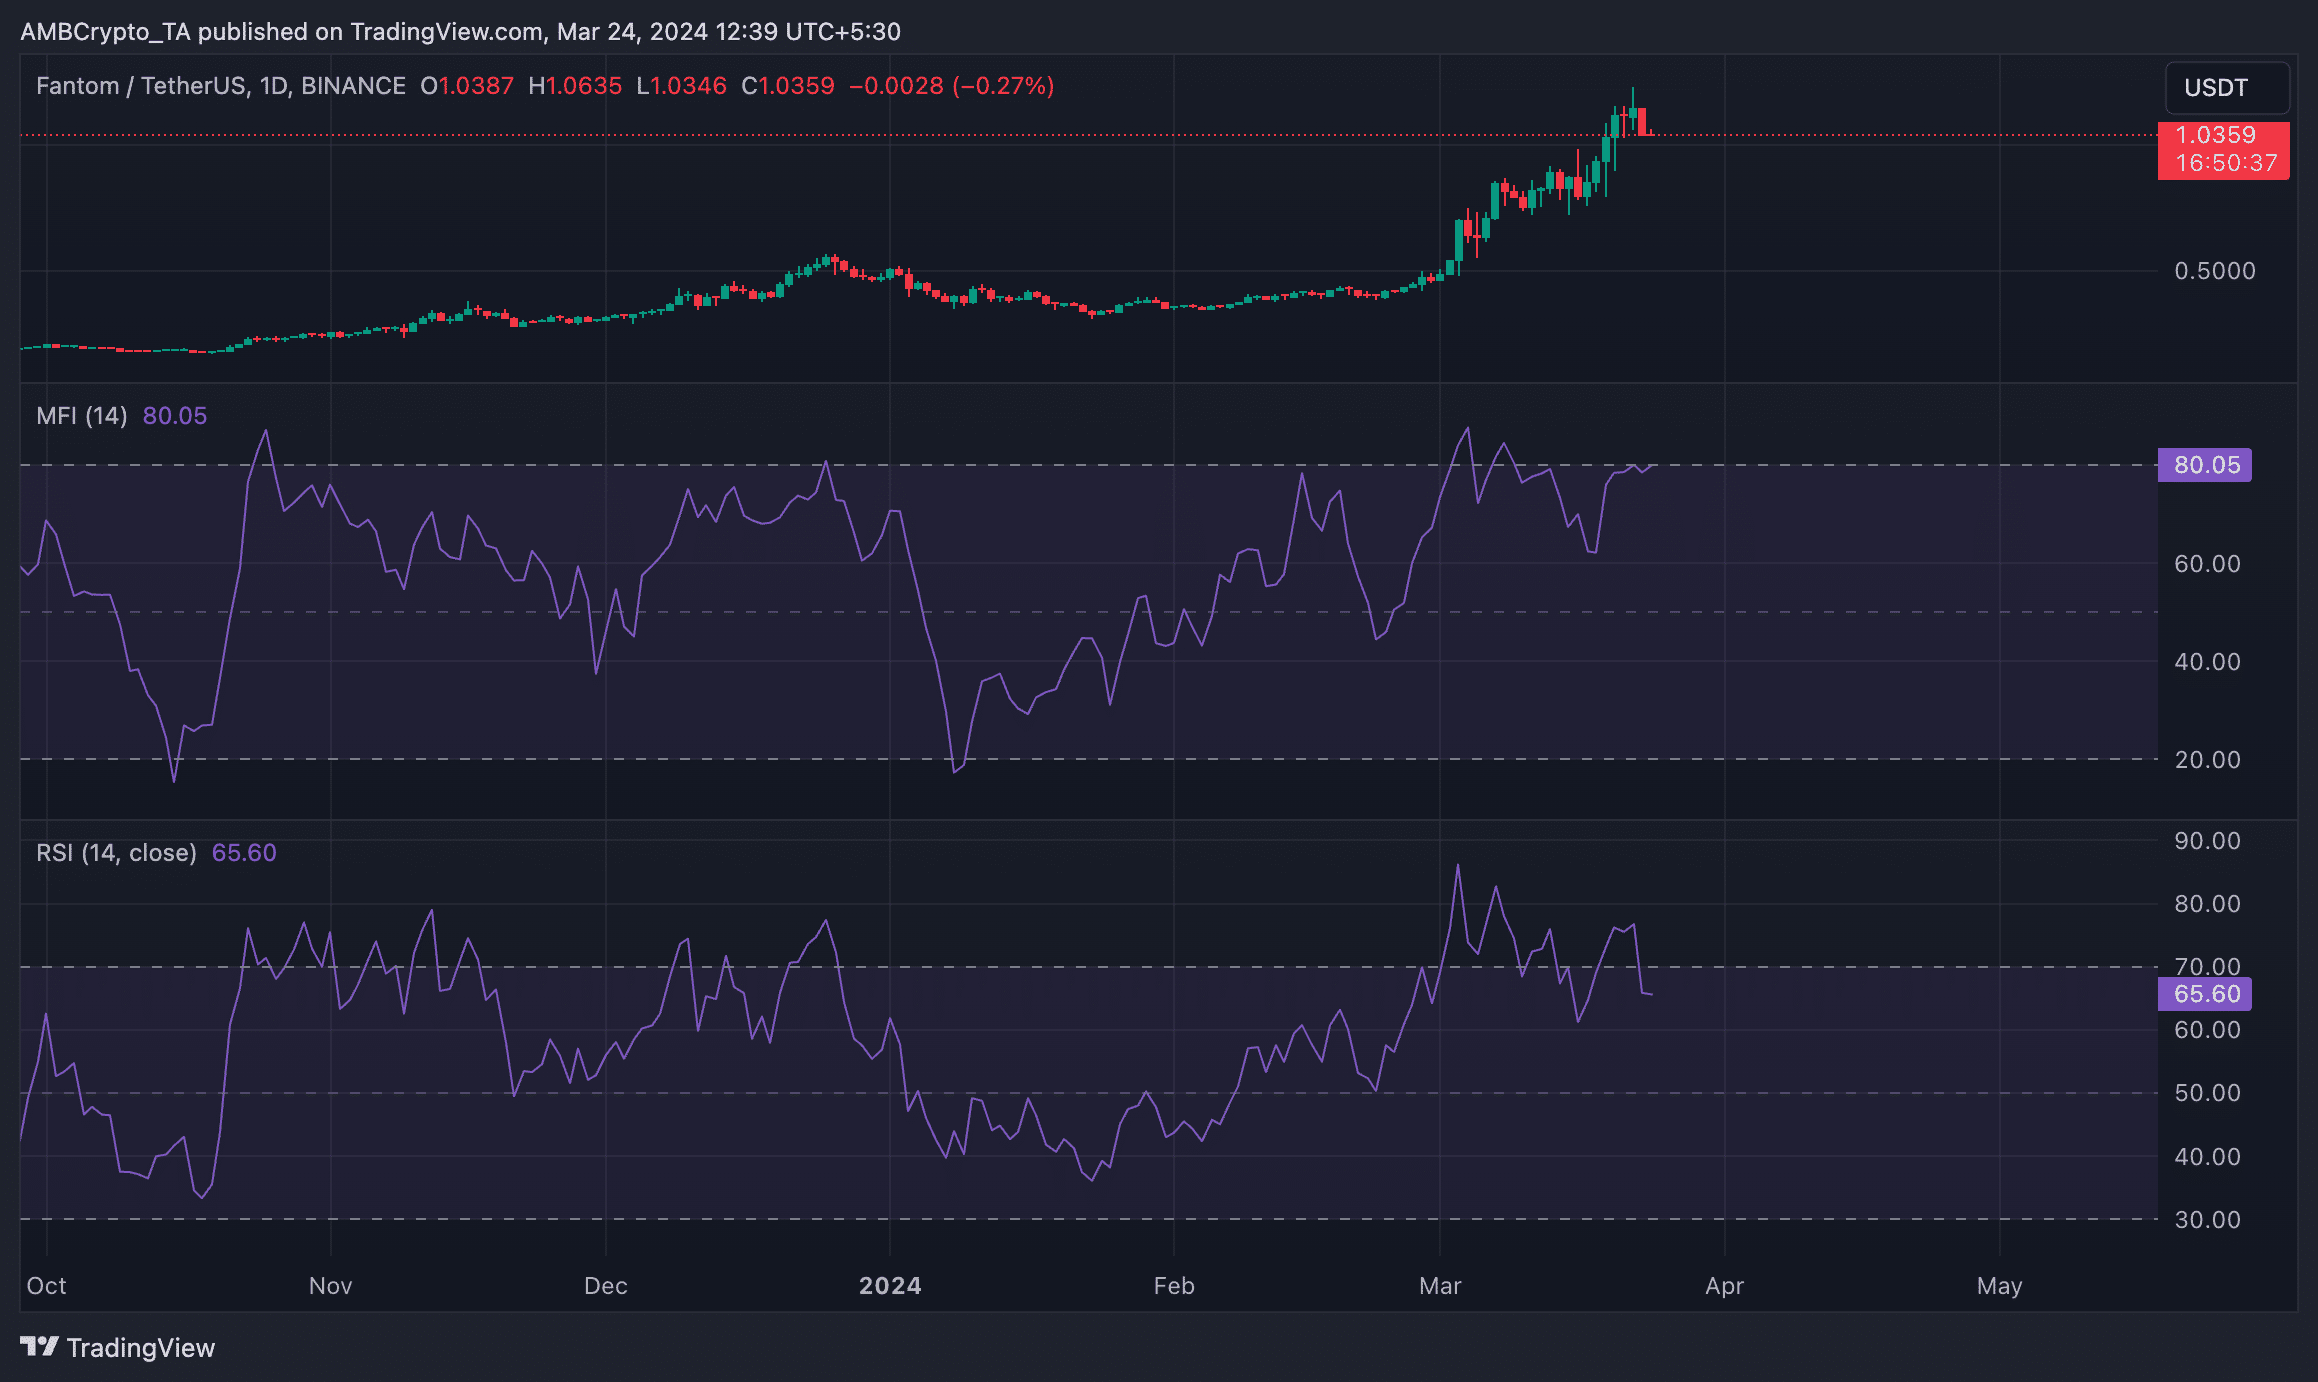
FTM, the native utility token that powers the entire Fantom blockchain ecosystem, witnessed a 34% growth in its price last week.
During the week, the token climbed to a 30-day high of $1.18 on 22nd March before witnessing a correction to its current market value of $1.06.
The double-digit rally in FTM’s value in the last week has been due to the sustained demand for it.
According to its key momentum indicators assessed on a 24-hour chart, despite the general market drawback, FTM investors continue to favor accumulation over selling their holdings for a profit.


Source: FTM/USDT on TradingView
Biggest losers
Injective [INJ]
Following an extended period of rally, INJ peaked at $52.38 on 13th March to close the week as the biggest loser.
Trading at $35.40 at press time, the altcoin’s price fell by 14% in the past seven days and by 32% from its recent peak.
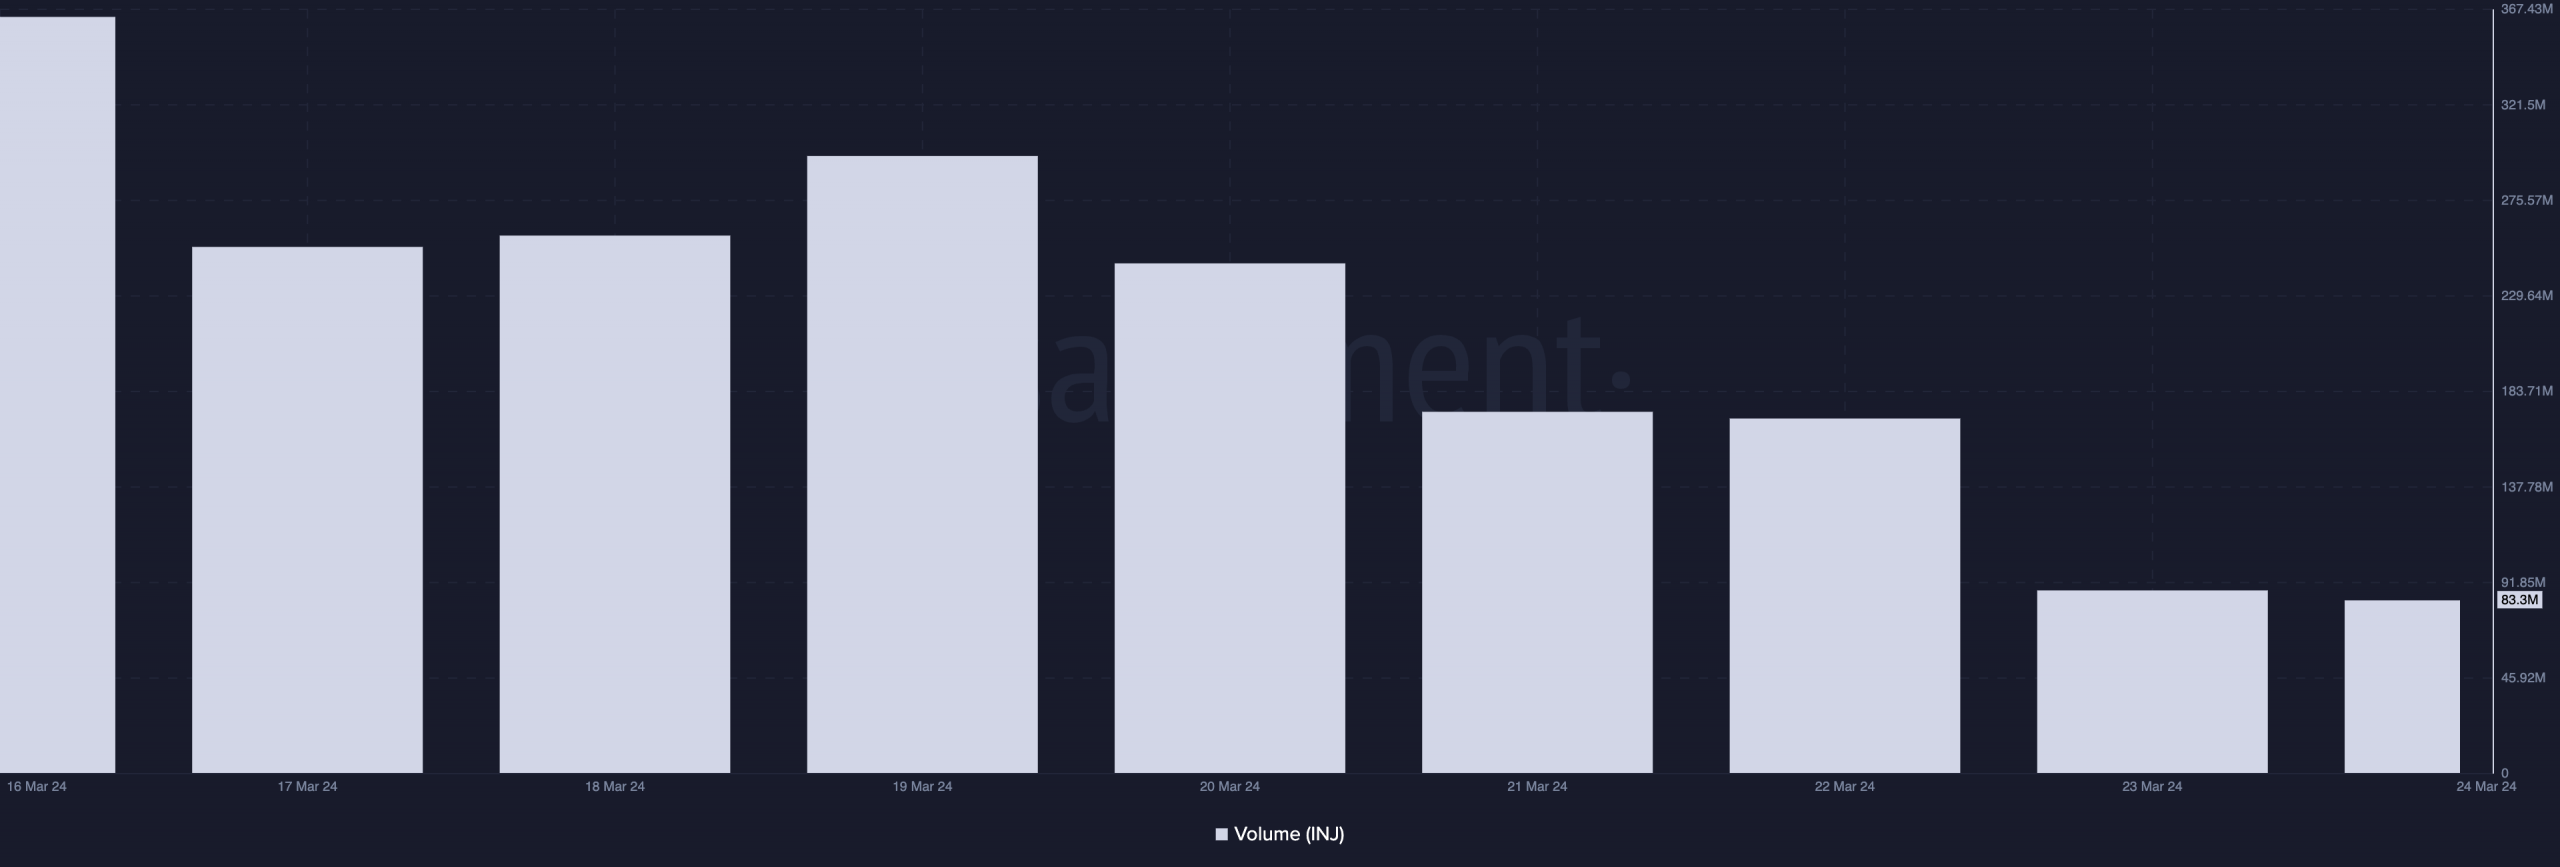
At the beginning of the week, INJ exchanged hands at $41.01. However, as the general market retraced, INJ’s daily trading volume shrunk by 65%, according to Santiment’s data.
This resulted in a corresponding decline in its value during the period under review.


Source: Santiment
The low trading volume was due to a decline in demand for the altcoin, on-chain data revealed. Per Santiment’s data, in the last week, the daily count of addresses involved in INJ transactions fell by 33%.
Likewise, the number of new addresses created to trade the altcoin daily plummeted by 14%.
Jupiter [JUP]
JUP, the token that powers Jupiter, the Solana-based decentralized exchange (DEX), ranked as the asset with the second-highest losses over the past week.
At press time, the governance token traded at $1.17, recording a 13% decline in its price during the period under review.
The token attempted to reclaim its $1.4 price mark on the 21st of March, but the buying pressure was not enough to sustain the rally, causing an additional 10% price decline since then.
Extending its weekly losses at press time, JUP’s value was down 3% in the past 24 hours due to a 30% fall in trading volume.
Bonk [BONK]
According to CoinMarketCap’s data, BONK, the Solana-based meme asset, ranked as the token with the third-highest weekly loss.
During that period, its value plunged by 11%. Although it made attempts at different points to initiate an upward correction, the general market’s bearish sentiment made this impossible.
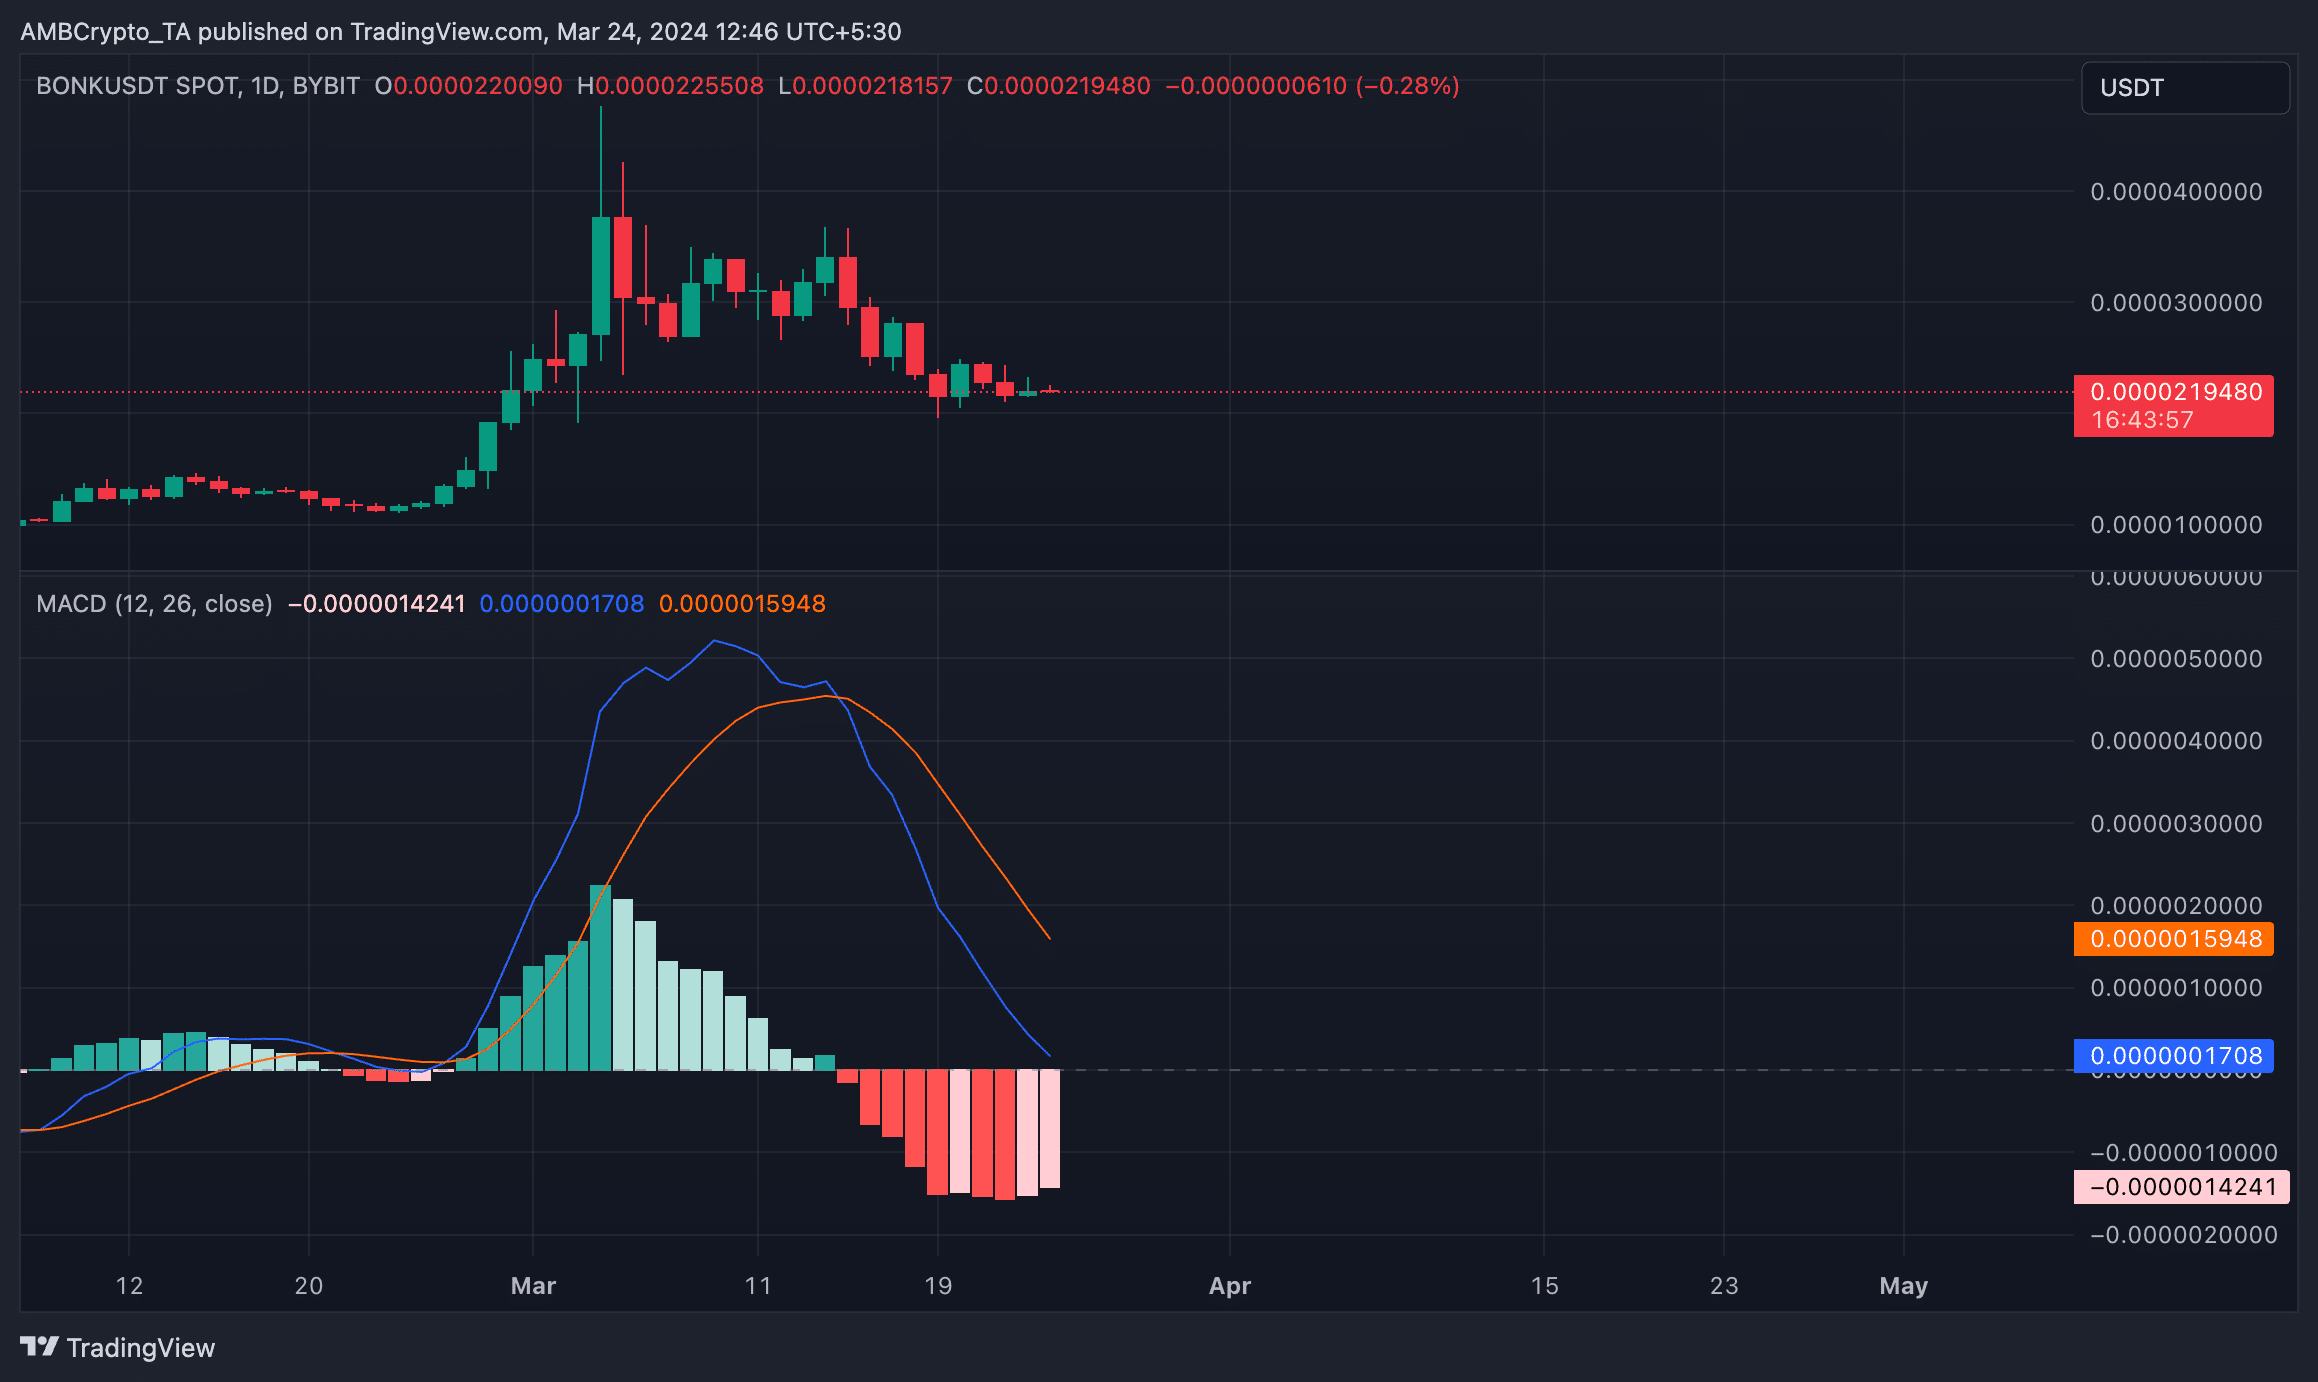
Confirming the bearish trend, BONK’s MACD line rested beneath its signal line to suggest that its short-term moving average is trending lower than the longer-term moving average.
This intersection signals the re-emergence of bears and a rise in selling activity.


Source: BONK/USDT on TradingView
At press time, BONK traded at $0.00002217, seeing a minor 0.23% price rally in the past 24 hours.


