- Most ADA transactions ended in a loss, prompting speculation that the price might drop again
- Price-DAA was below 0.50, indicating that it could be time to buy the token
Losing 5.42% of its value in the last 7 days is something that has allowed Cardano [ADA] to emerge as one of the market’s worst performers the top 20. Now, while the token might not be new to this tag, some market participants believe that it could be a good time to buy the token.
To lend further insight into this, AMBCrypto considered an in-depth on-chain analysis. At press time, ADA’s price was $0.45. Its latest bout of depreciation has affected its transactions in profit and loss on the Cardano network.
Cardano stops giving and keeps taking
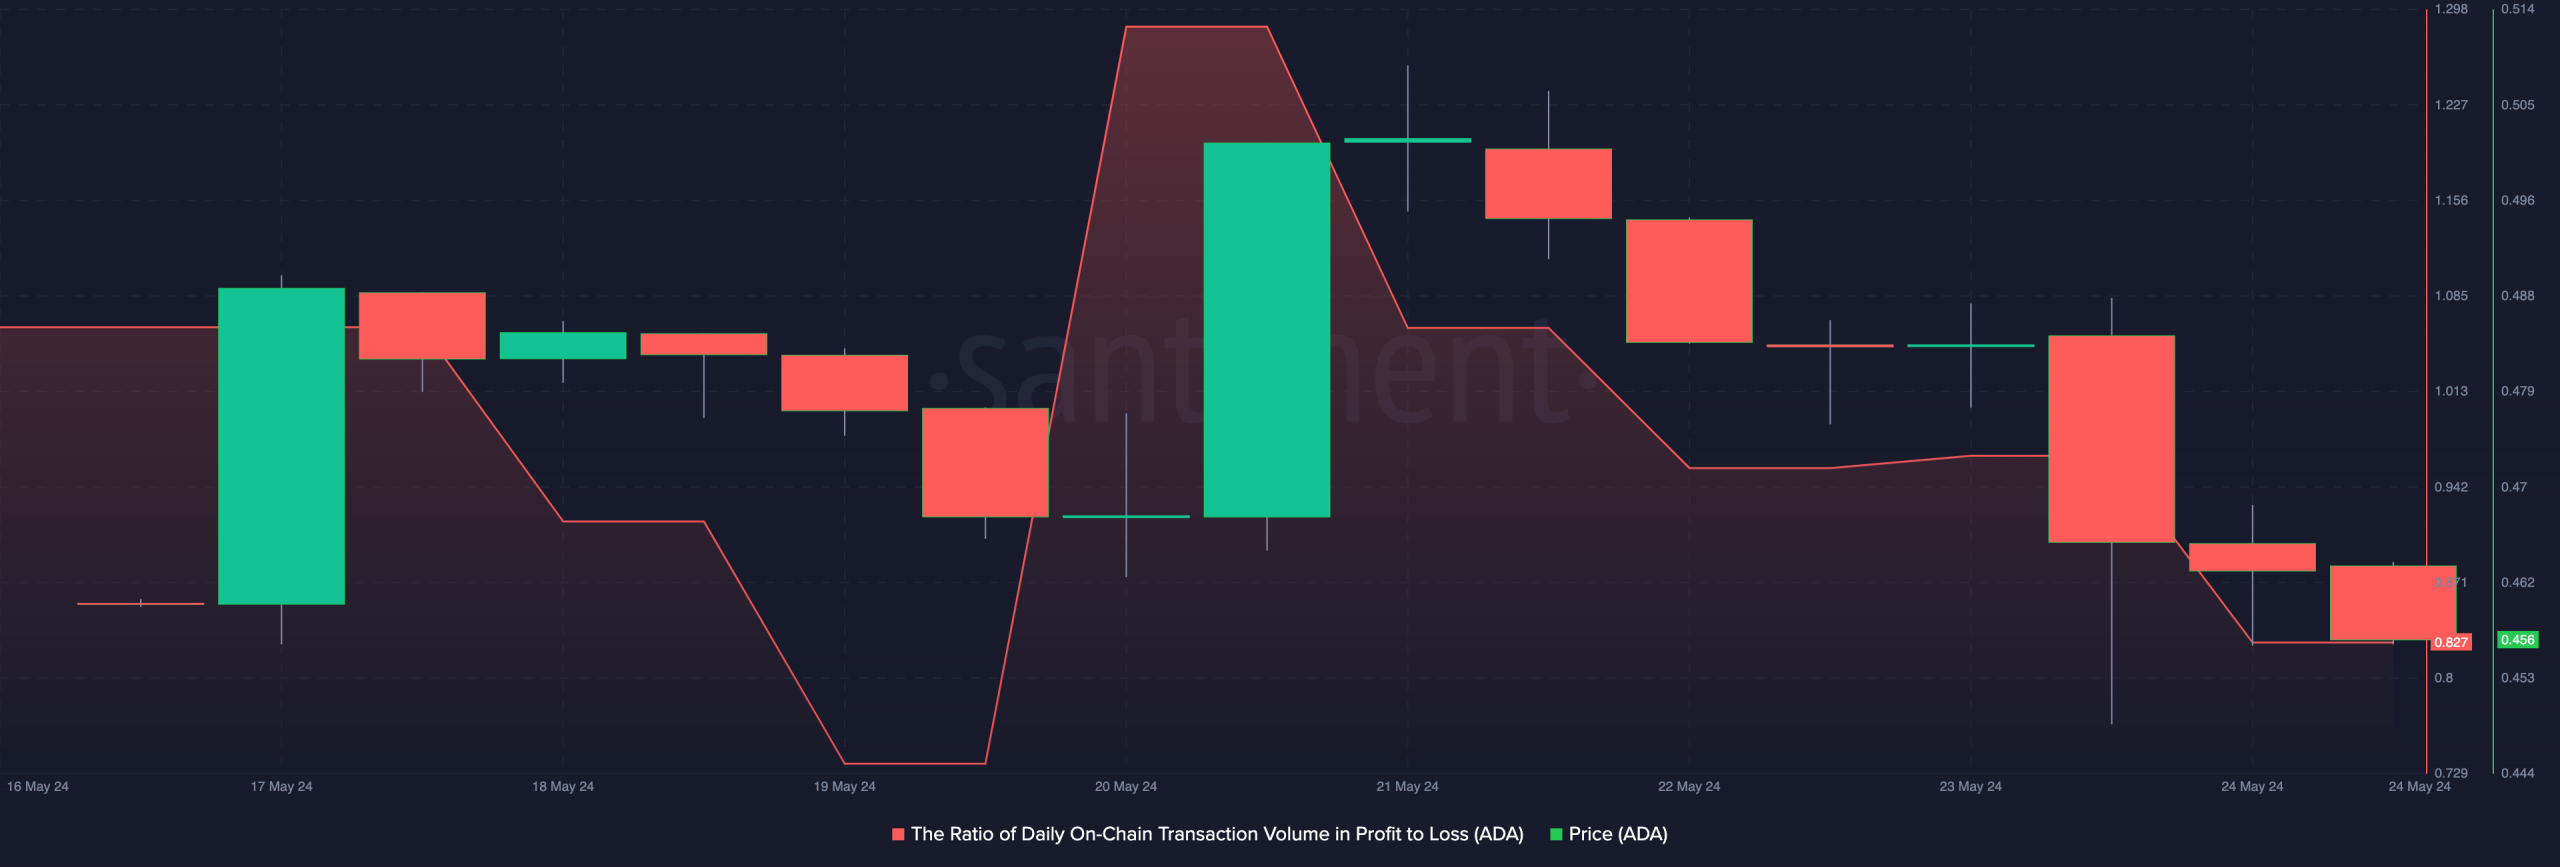
According to Santiment, the ratio of daily on-chain transactions volume in profit to loss was 0.827 at press time. If this ratio is over 1, it means that there are more participants realizing gains than losses.
In this case, ADA’s trend would have been bullish. However, the reading above indicated that only 0.827 transactions ended in profits, when compared to every on-chain transaction that realized a loss.
Historically, this metric seems to correlate with the price. For instance, the ratio hit 0.722 in February. At the time, ADA’s price was $0.57. A few weeks later, the price jumped to $0.73 on the charts.


Source: Santiment
A similar scenario transpired on 13 April. At that time, the decline in the ratio triggered ADA’s bounce from $0.43 to $0.52. Considering its past performances, there is a chance Cardano might drop further.
If this is the case, the value of the cryptocurrency might drop to $0.42. However, there is a high chance that ADA might produce a 20% hike too, meaning a rise to $0.50 within a few days.
An entry level has appeared
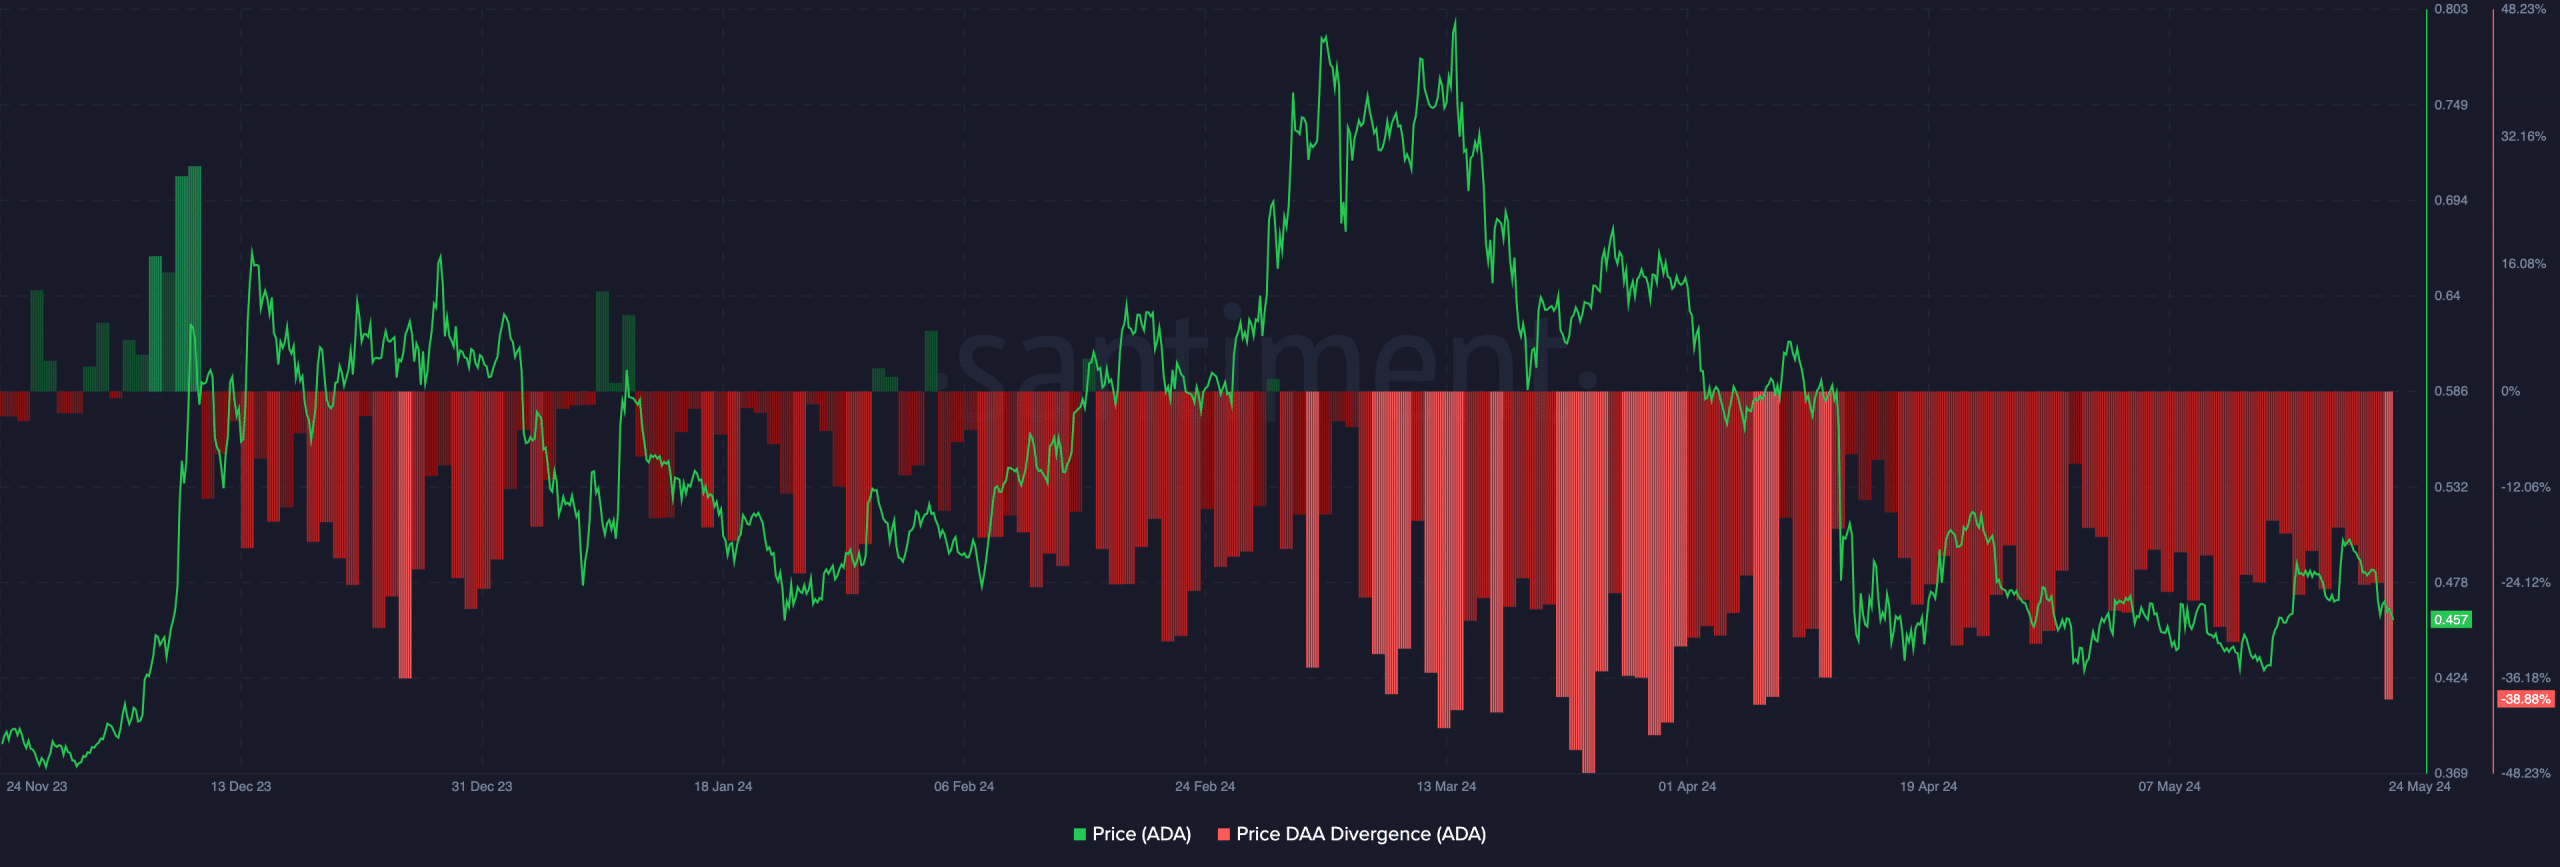
Additionally, the price-DAA divergence is an indicator that can predict ADA’s valuation. DAA is an acronym for Daily Active Addresses, used to measure the overall level of network activity.
When combined with the price, the metric can identify potential exit and entry points. At press time, the price-DAA was -38.88%. From a trading perspective, a buy signal appears when the metric is less than 0.50.
On the other hand, a sell signal appears when the divergence is at 0.90 or above. Since the ratio was 0.388, it seemed to be a sign that it could be time to start Dollar Cost Averaging (DCA) Cardano’s native token before the price pumps.


Source: Santiment
However, it is important to note that this metric alone cannot dictate where Cardano might be heading.
Assessing the same using the volume, on-chain data revealed that the metric hiked on the charts. This is an indication of more buying and selling. However, a look at the price action would suggest that there have been more sales than accumulation.
Read Cardano’s [ADA] Price Prediction 2024-2025
As long as this remains the case, ADA might face another decline as mentioned above. However, if the decline gets too intense, the token could rally back to its yearly peak.


