- DOGE and SHIB’s prices dropped by over 13% and 14%, respectively.
- Market indicators suggested that SHIB and DOGE bulls might takeover.
The crypto market was in turmoil last week, and top memecoins like Dogecoin [DOGE] and Shiba Inu [SHIB] were among the most affected.
The drop in these top memecoins’ prices also resulted in a sharp decline in their dominance. Does this mean a further price plummet for these coins?
Dogecoin and Shiba Inu are shedding
CoinMarketCap’s data revealed that these two top memecoins witnessed double-digit price declines last week.
To be precise, DOGE’s value dropped by over 13% while SHIB’s price plummeted by more than 14%. At the time of writing, DOGE was trading at $0.1246, and SHIB had a value of $0.00001857.
While the memecoins fell victim to price corrections, their dominance also fell.
Ki Young Ju, a popular crypto analyst, recently posted a tweet highlighting a drop in memecoin dominance over the past few months.
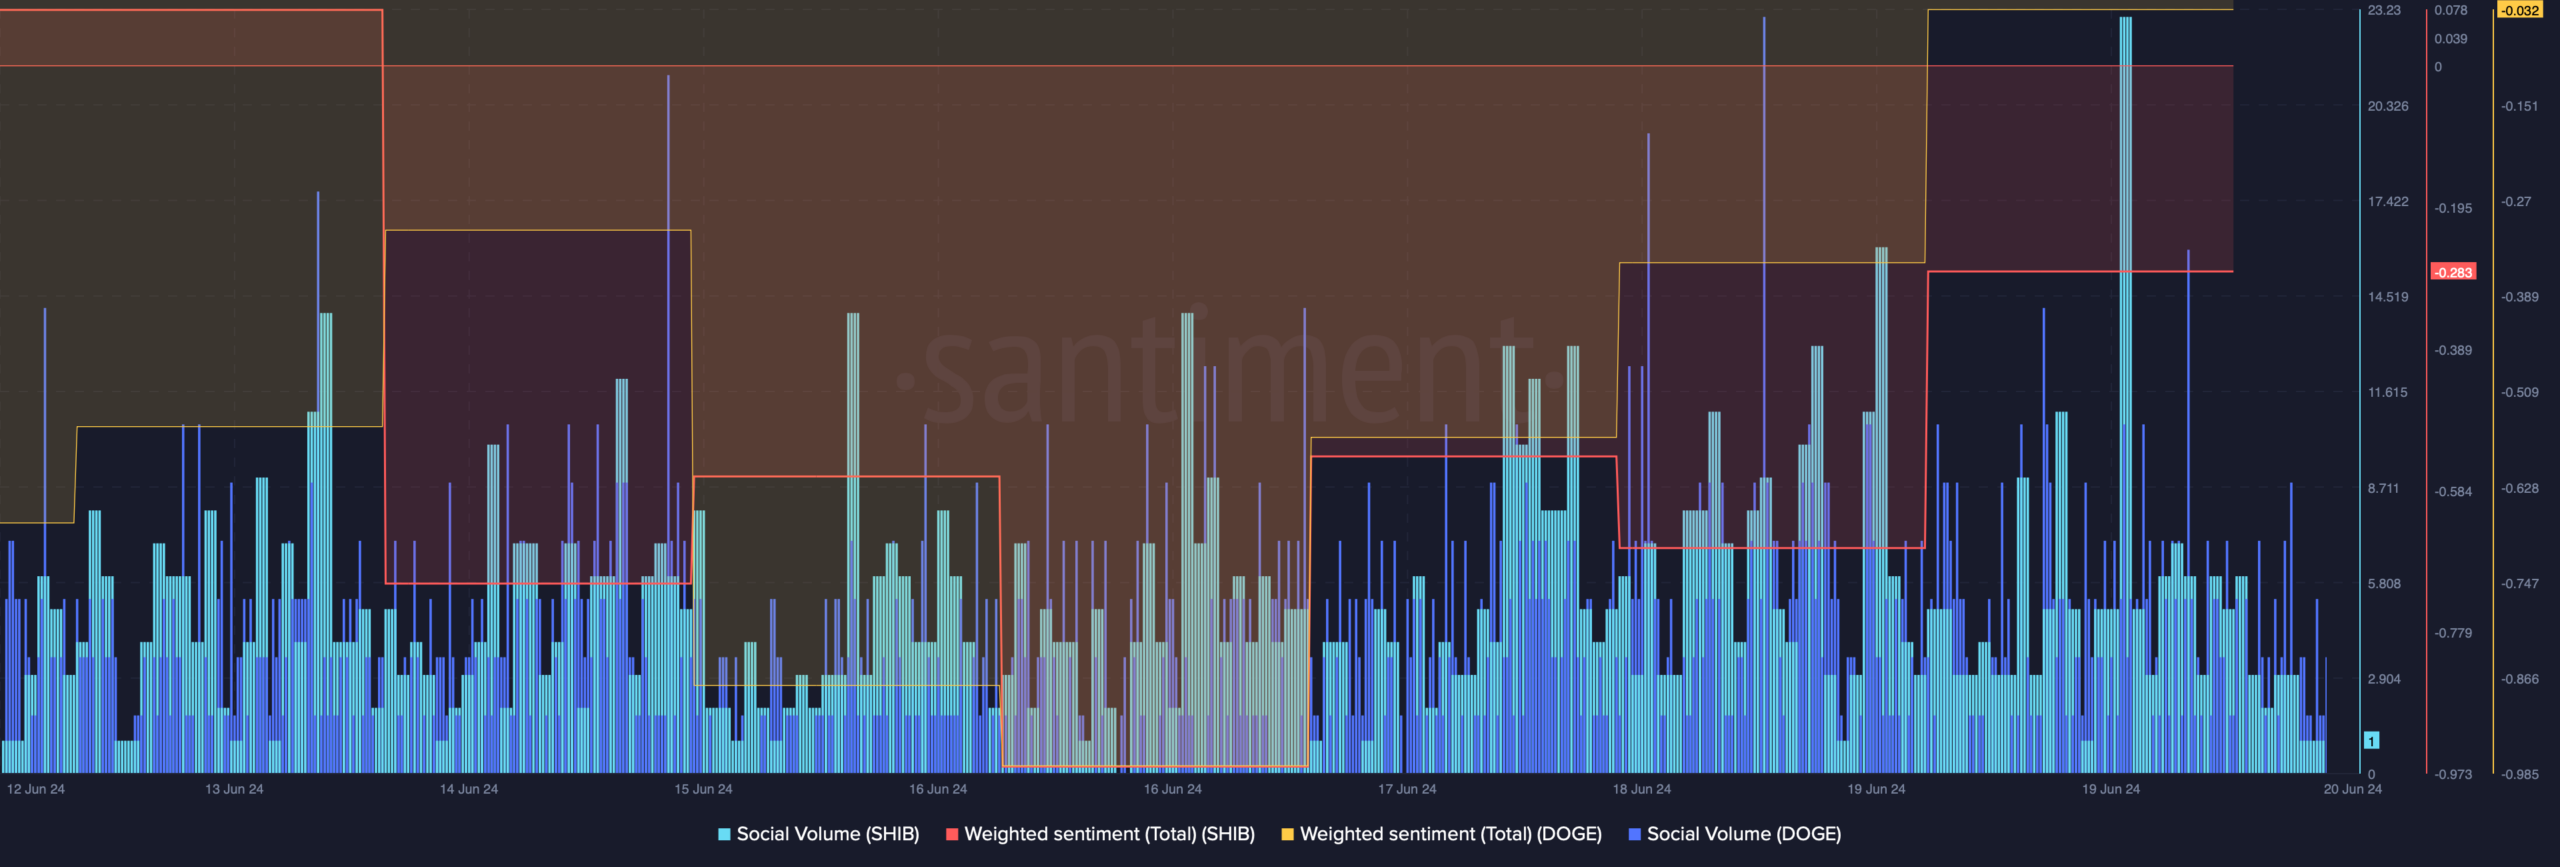
AMBCrypto’s analysis of Santiment’s data revealed that despite the drop in price, both SHIB and DOGE’s weighted sentiments improved. This meant that bearish sentiment around these memecoins was declining over the last few days.
Additionally, their social volumes also spiked, suggesting that investors at large were talking about Shiba Inu and Dogecoin.

Source: Santiment
DOGE, SHIB preparing for a further price drop?
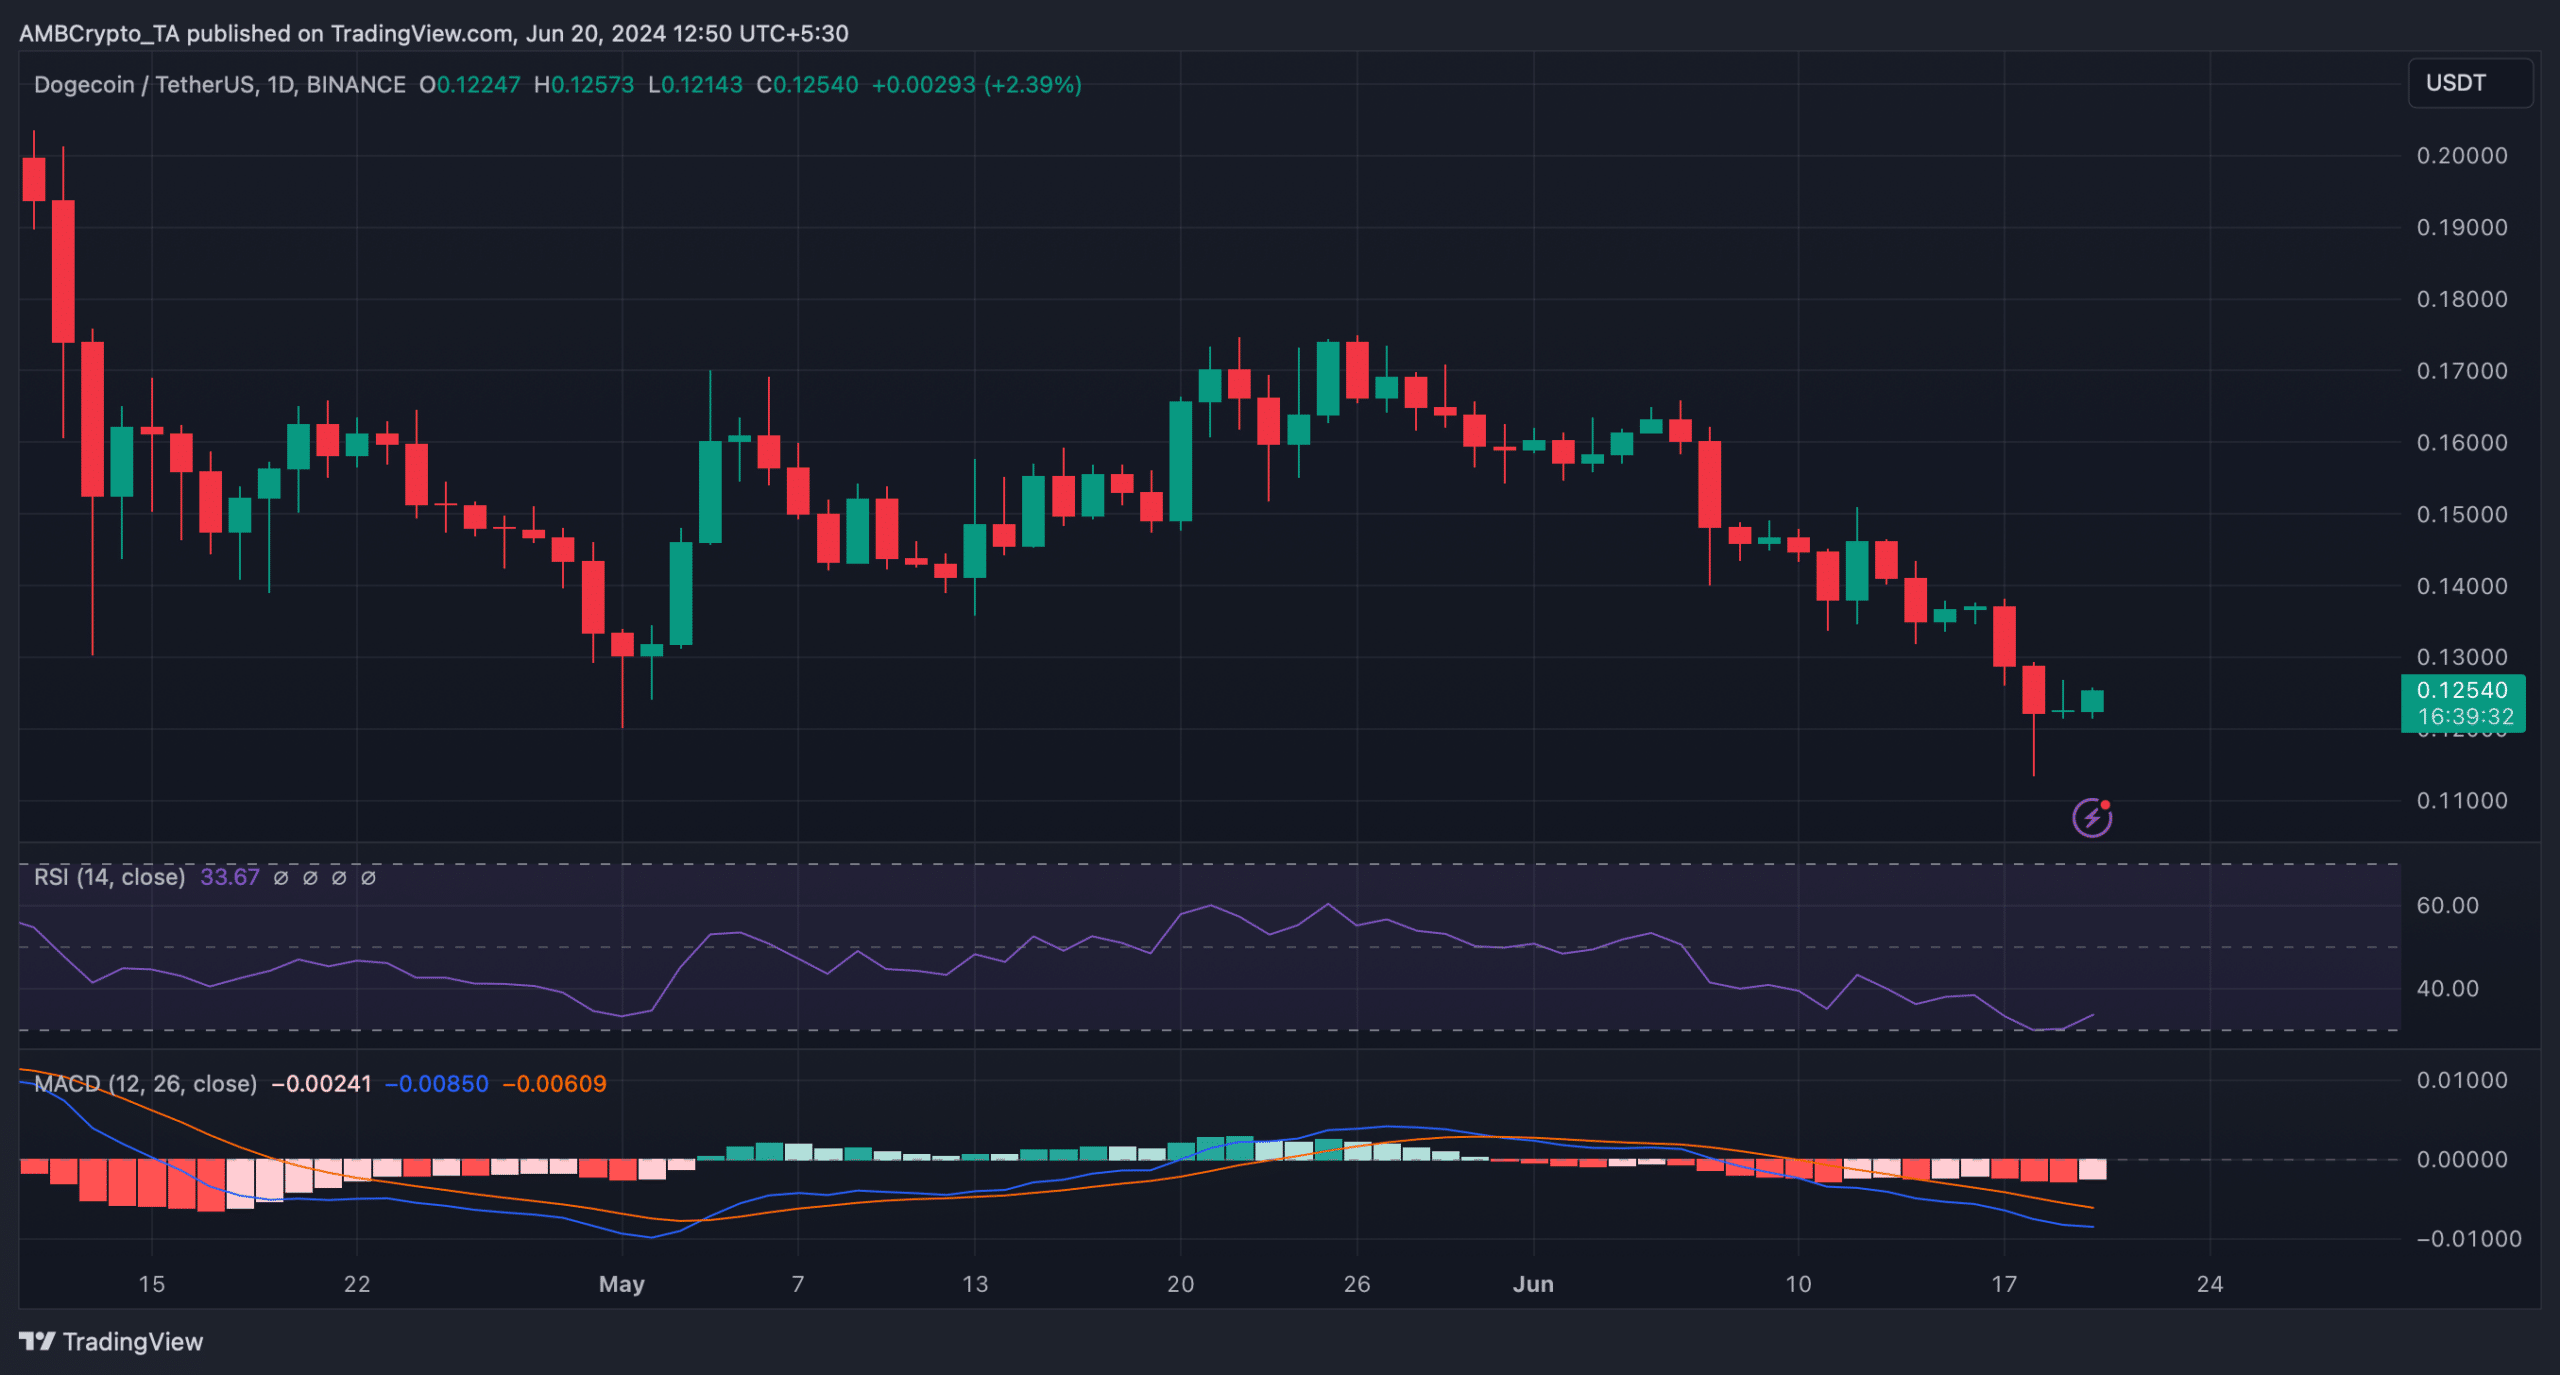
We then took a look at DOGE’s daily chart to find out what to expect from the memecoin. As per our analysis, DOGE’s Relative Strength Index (RSI) registered an uptick after touching the oversold zone.
This hinted at a trend reversal, which might allow DOGE to recover from the recent losses. However, the MACD displayed a clear bearish advantage in the market.

Source: TradingView
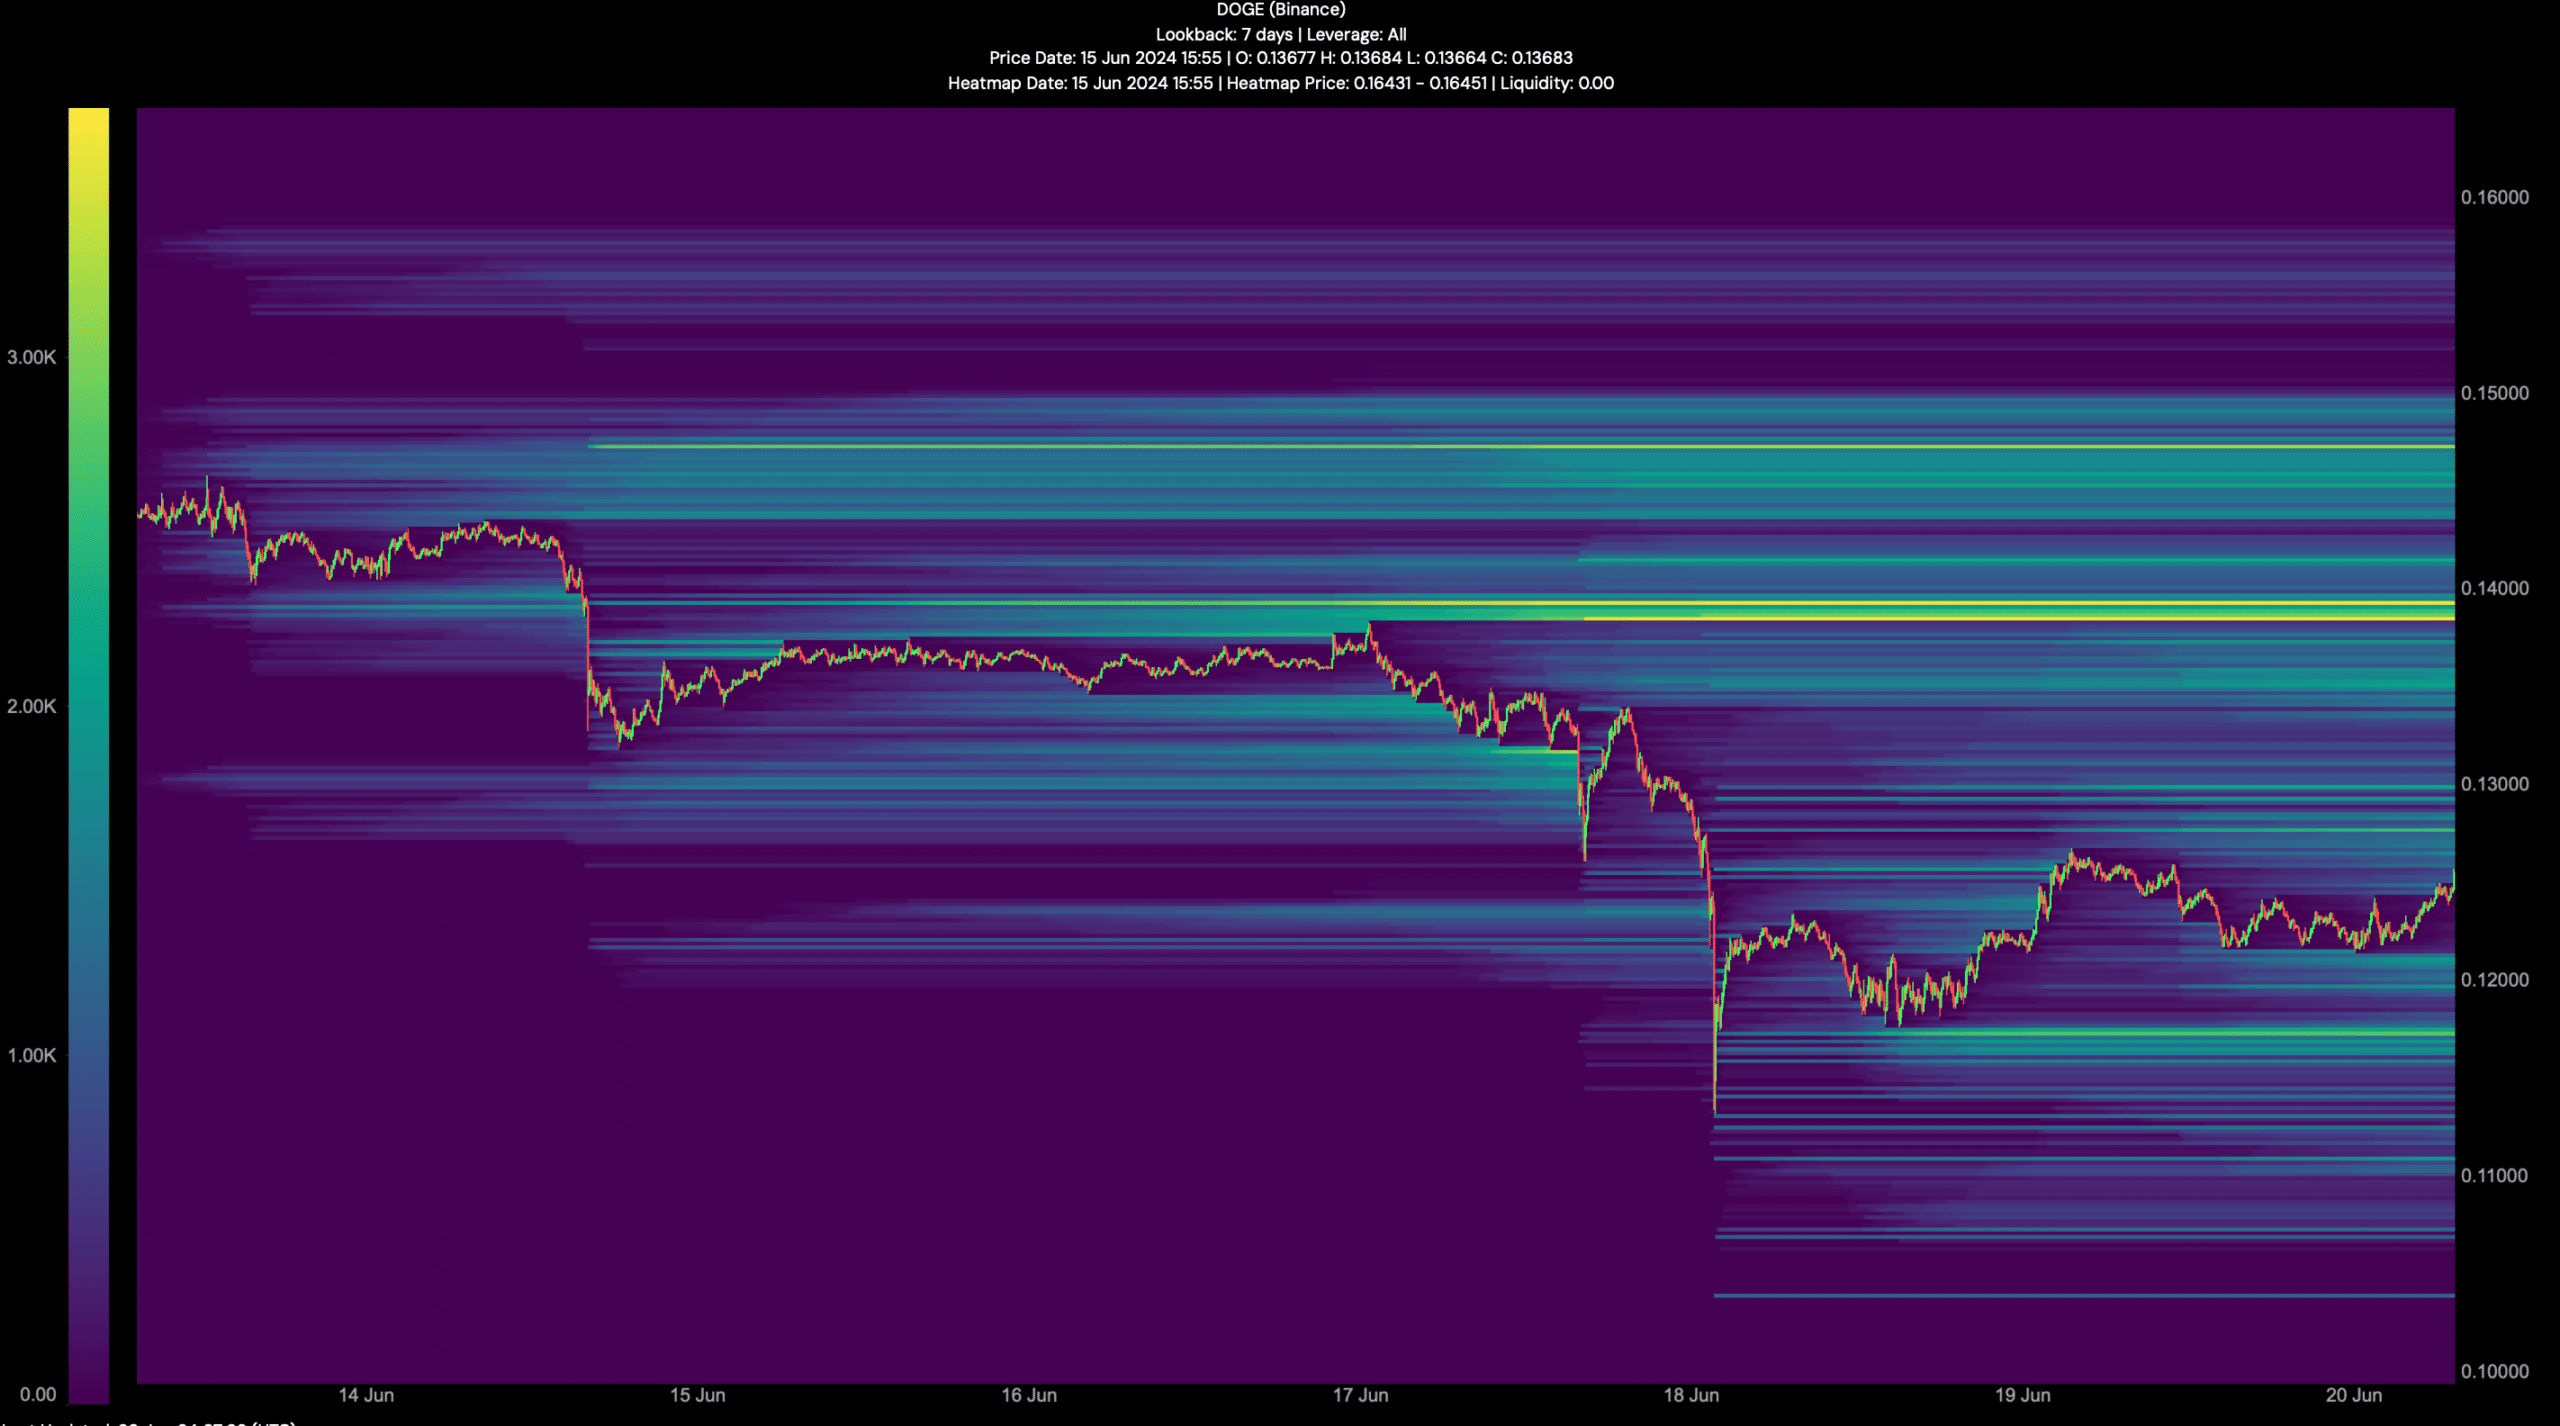
If DOGE bulls step up and manage to initiate a trend reversal, then investors might soon witness DOGE reclaiming $0.14.
However, if the bearish price trend continues further, DOGE might plummet to $0.117 in the coming days.

Source: Hyblock Capital
While DOGE’s future might get better, things for SHIB looked bearish.
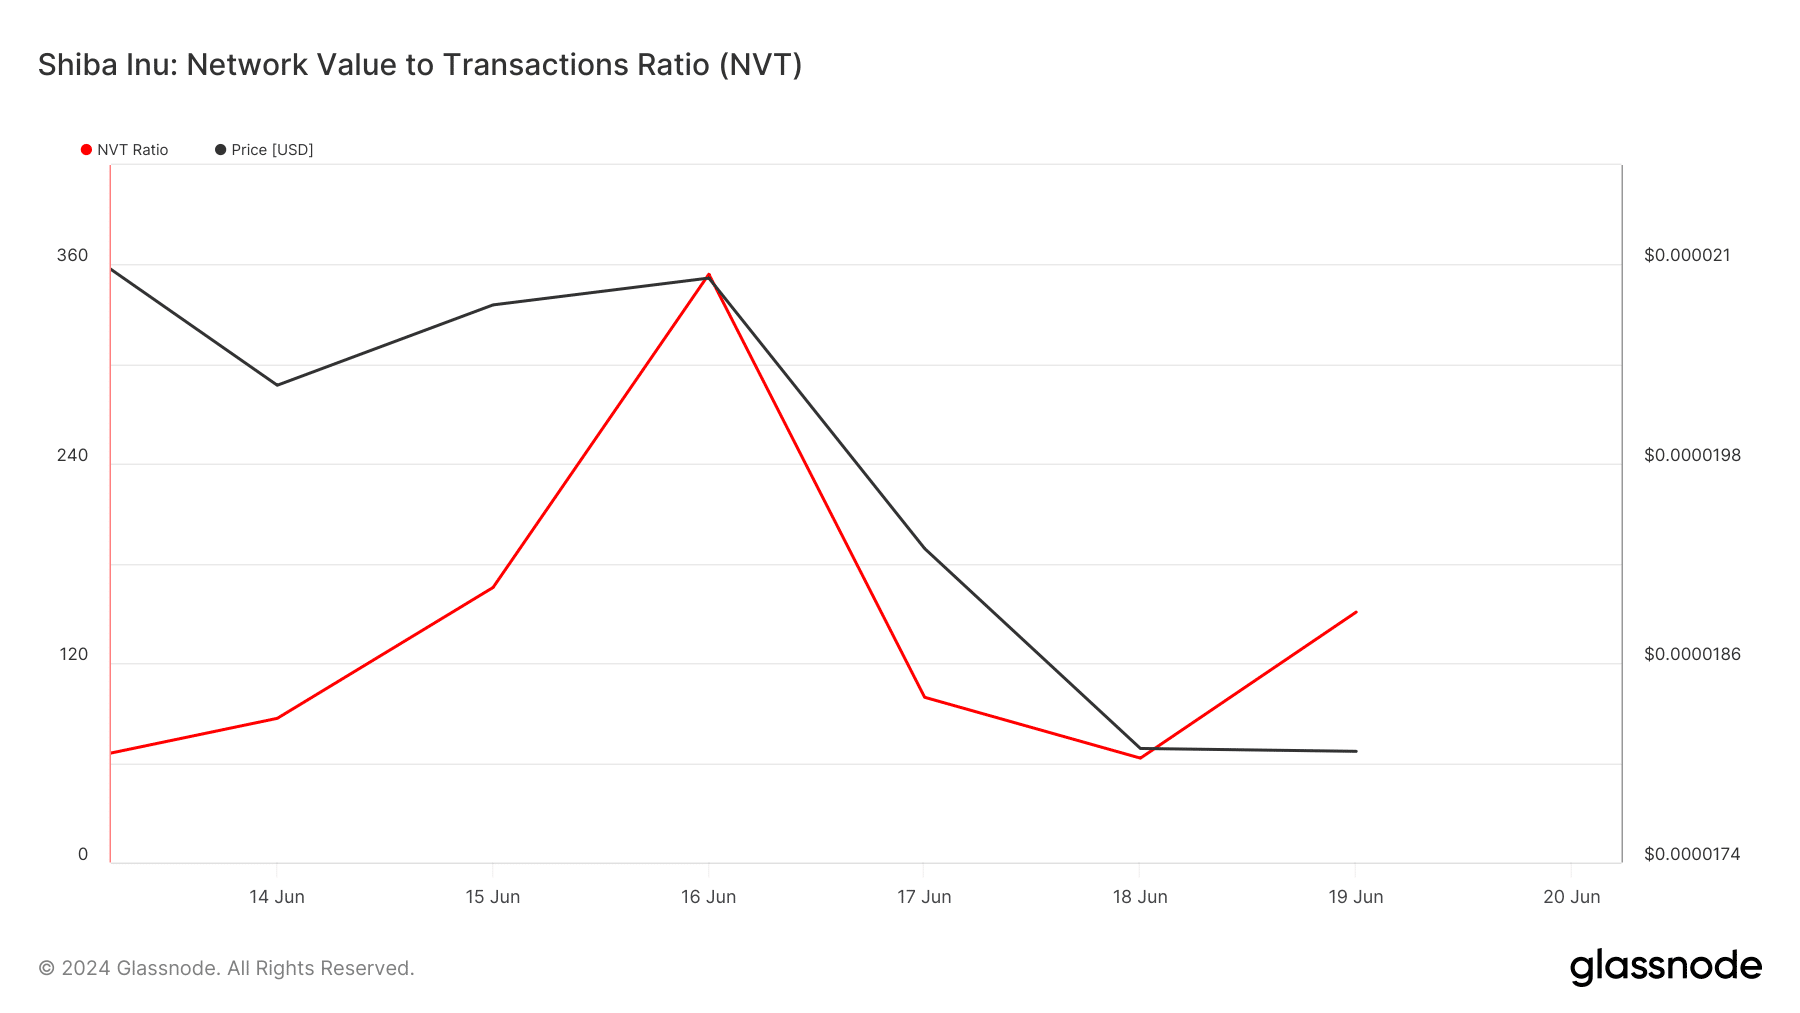
AMBCrypto’s look at Glassnode’s data revealed that its NVT ratio registered an uptick after a sharp decline. A rise in the metric means that an asset is overvalued, hinting at a further price drop.

Source: Glassnode
Is your portfolio green? Check out the Shiba Inu Profit Calculator
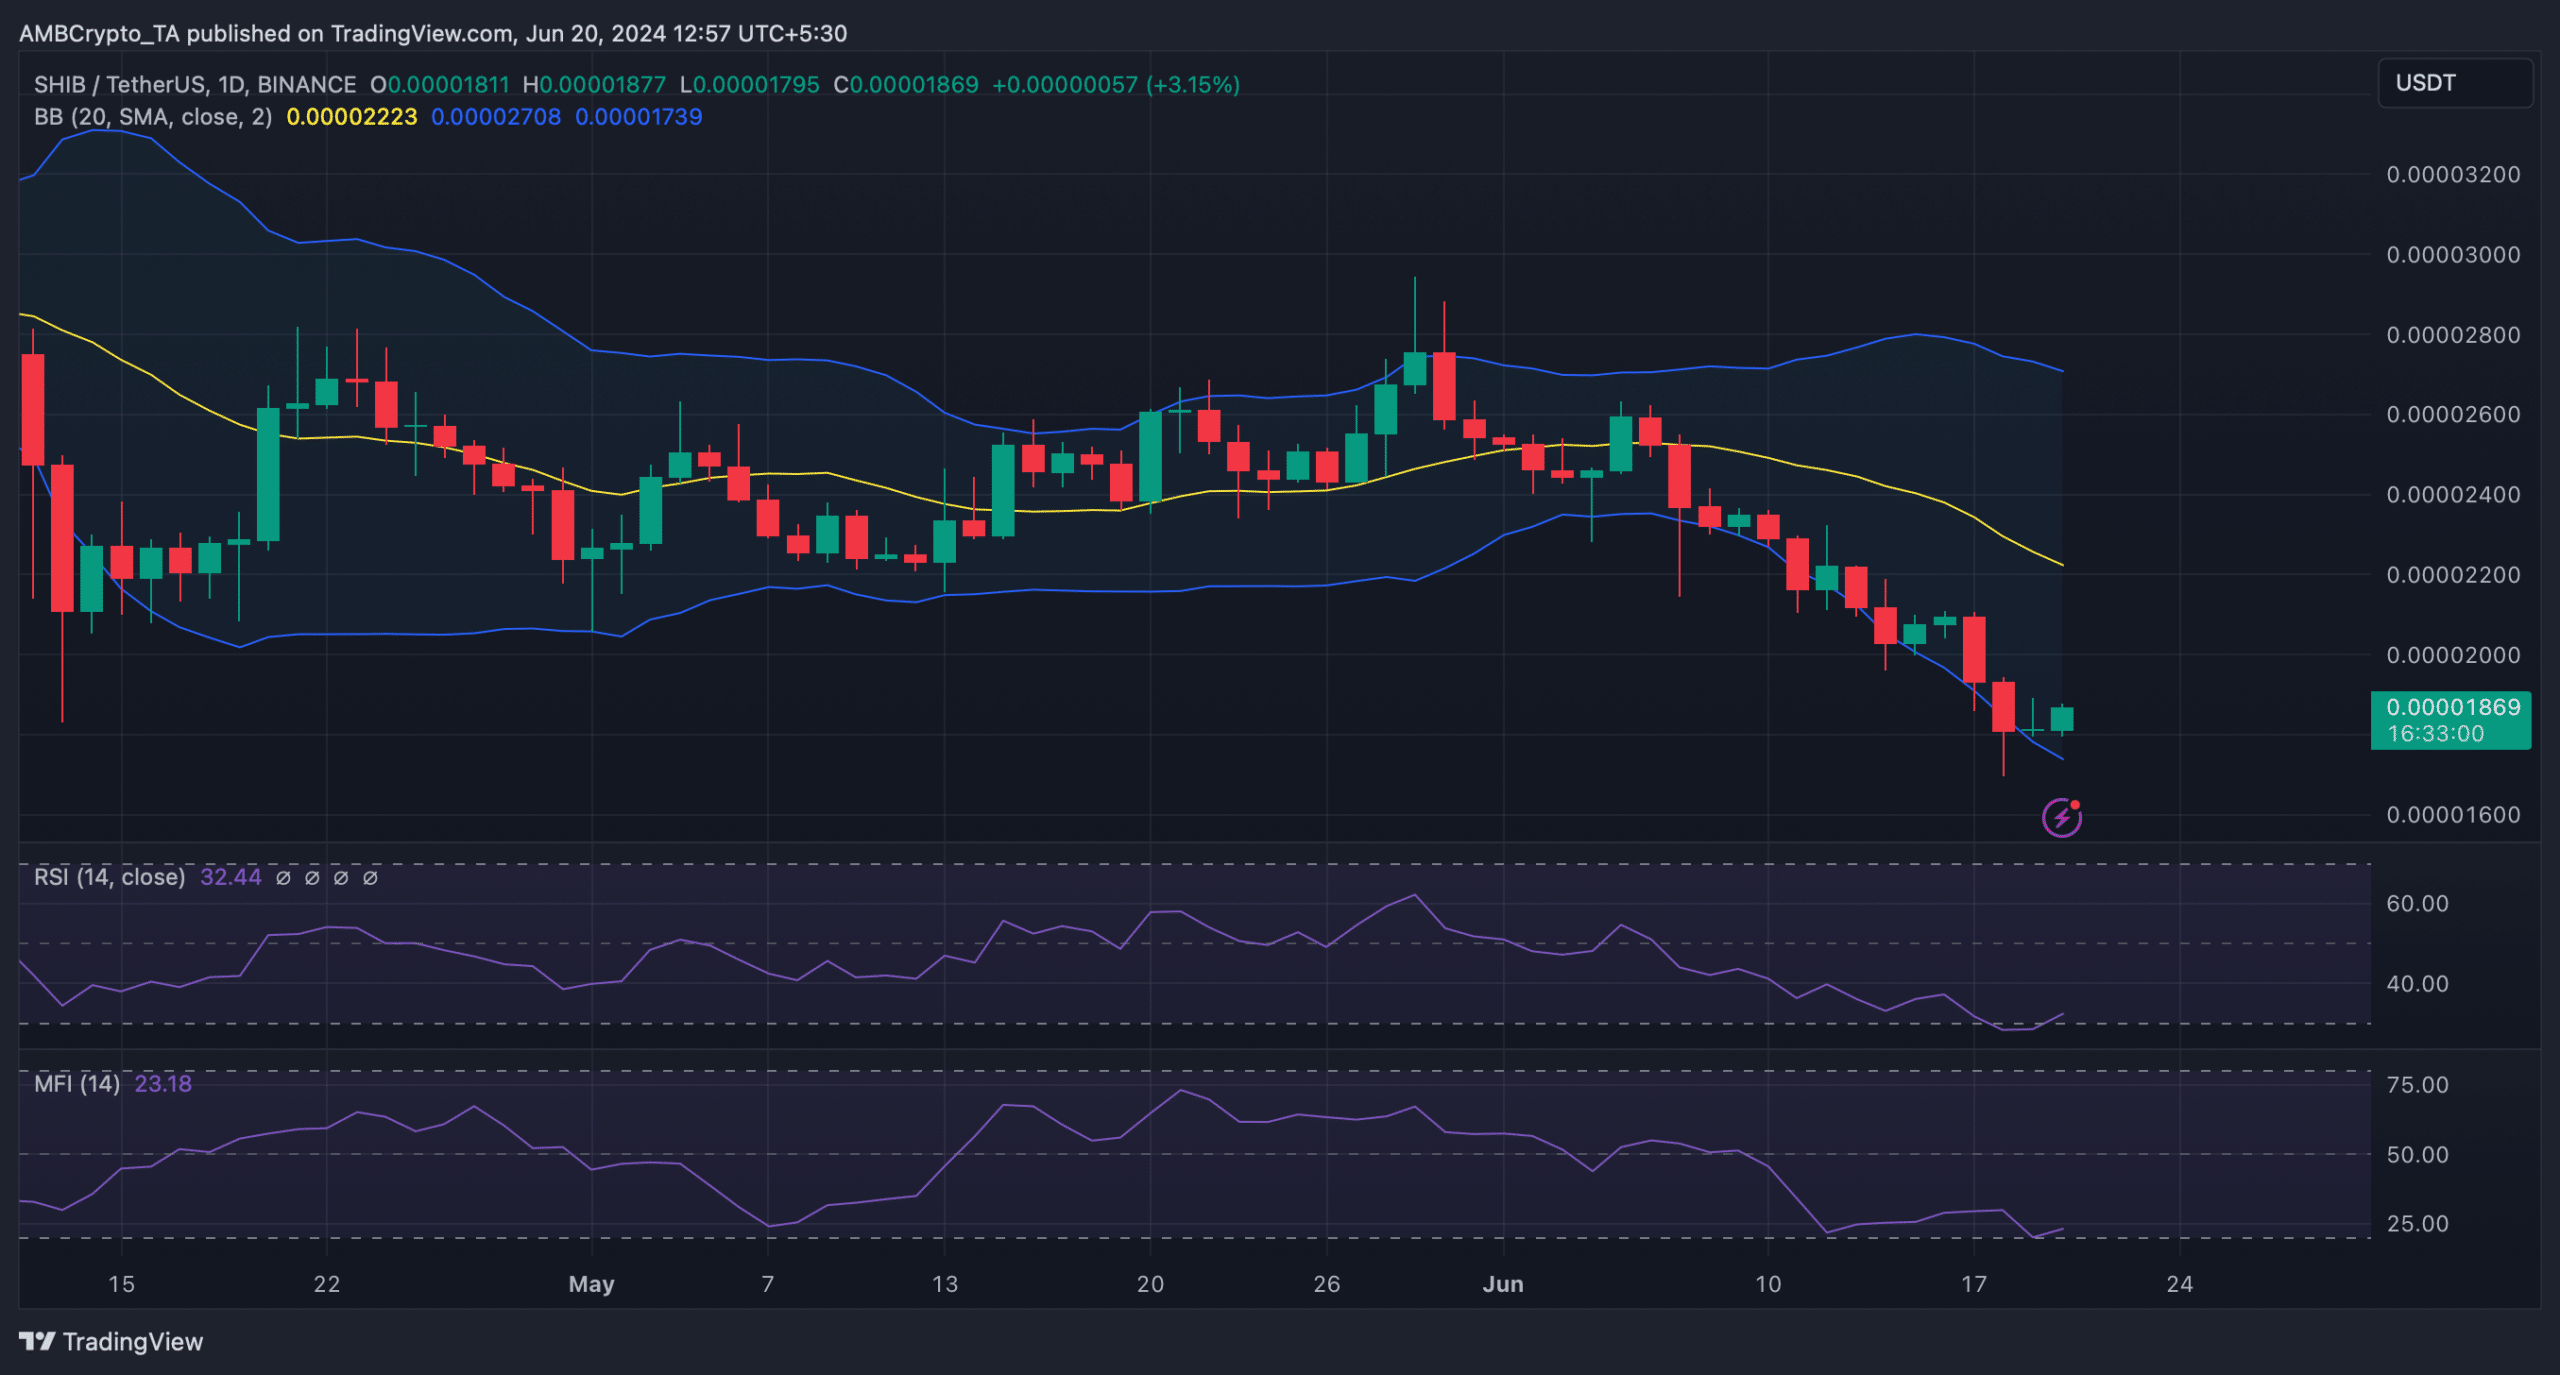
To see whether that’s true, we then checked Shiba Inu’s daily chart. As per our analysis, SHIB’s price had touched the lower limit of the Bollinger Bands, which often results in price upticks.
Additionally, both SHIB’s Money Flow Index (MFI) and Relative Strength Index (RSI) registered upticks. These indicators suggested that the possibility of a trend reversal for SHIB was high.

Source: TradingView


