- BOME maintained a bullish market structure on the 4-hour chart.
- The stable demand in recent days in the spot market was a sign of buyer strength.
Book of Meme [BOME] registered gains close to 20% in the past 24 hours, while Bitcoin [BTC] shed 6.55%. The trading volume behind the meme coin was close to the past week’s average.
This casts some doubts on whether the breakout will be sustained. However, its bullish performance while most of the market saw intense selling pressure was encouraging.
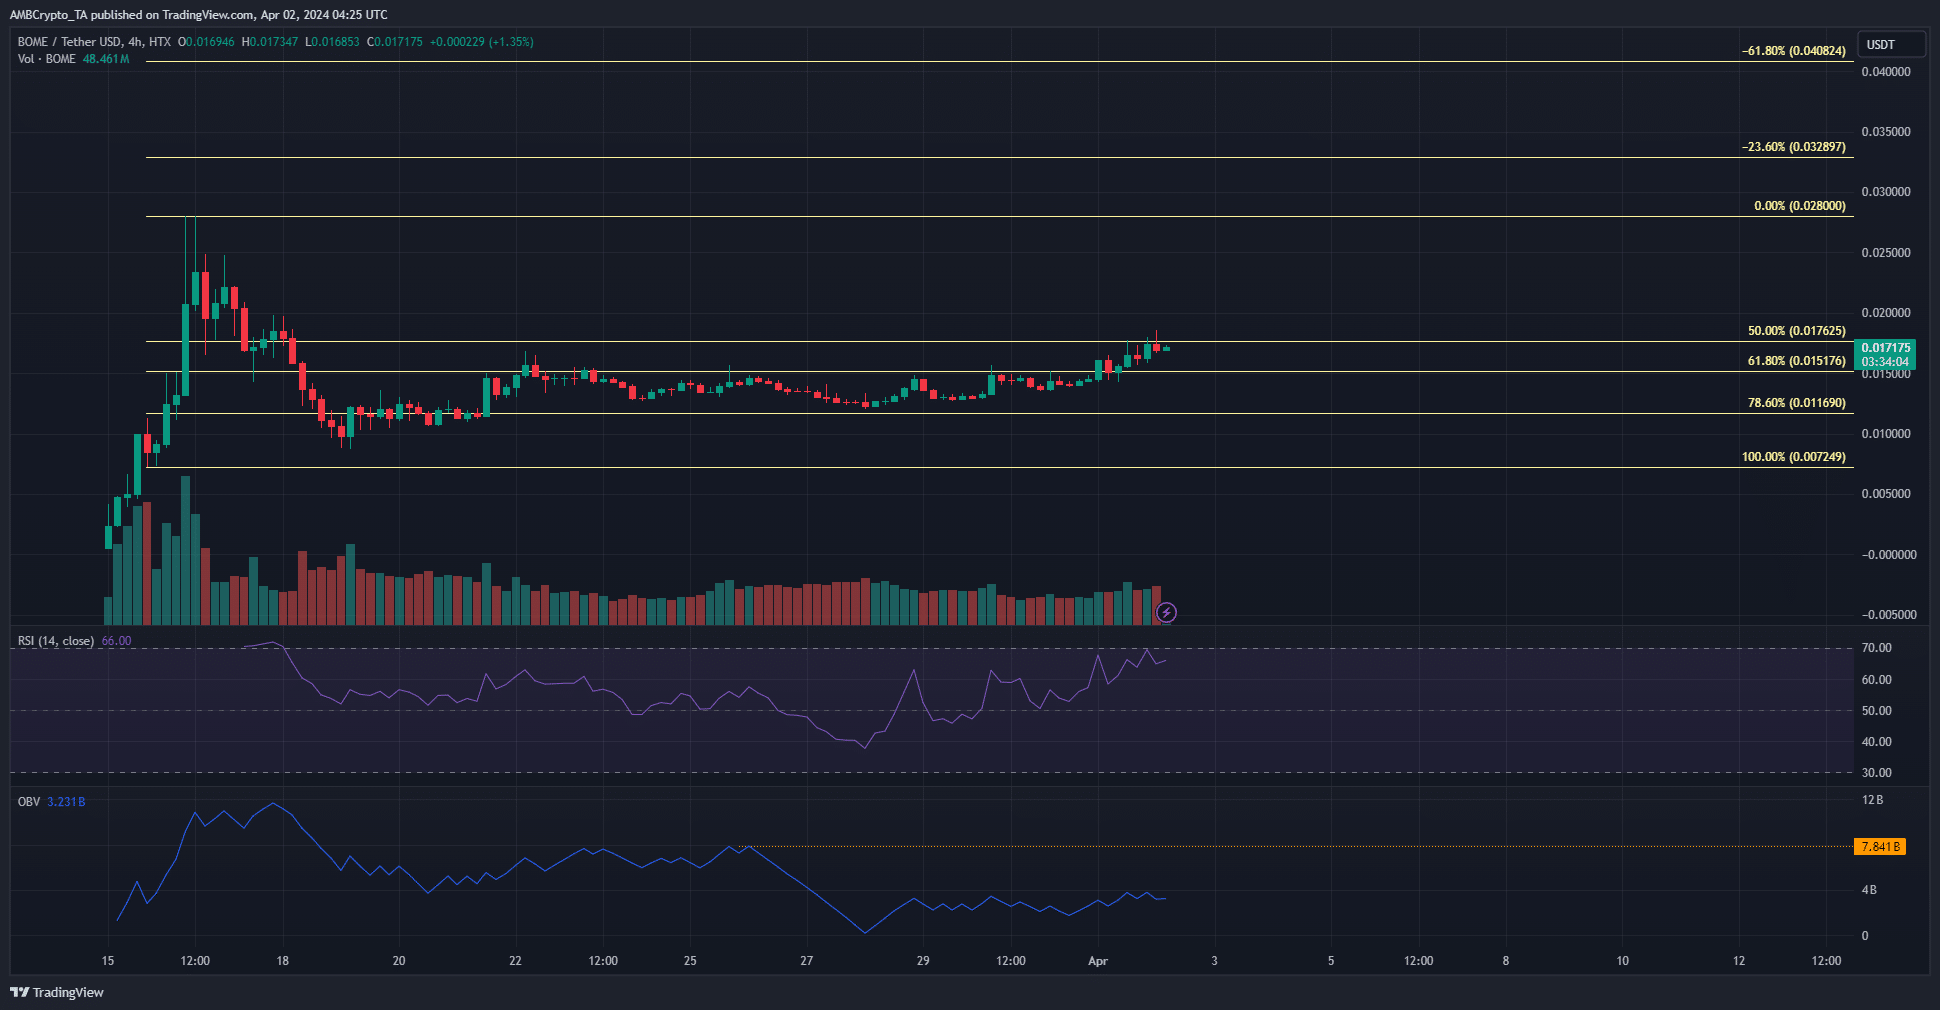
The local short-term resistance has been flipped to support


Source: BOME/USDT on TradingView
Based on the rally from$0.00725 to $0.028, a set of Fibonacci retracement levels was drawn. It showed that over the past ten days, the 61.8% retracement level at $0.0151 has acted as a short-term resistance level.
The market structure on the 4-hour chart remained bullish despite the retracement below the 78.6% level. The past few days saw the RSI climb above neutral 50, reinforcing the idea of strong short-term bullishness.
Conversely, the OBV was far below a recent high, marked in orange. The price has climbed above the 61.8% level, but the OBV was unable to beat the highs from then.
This was evidence of a lack of sustained buying pressure, which could impede the bulls’ progress in the coming days.
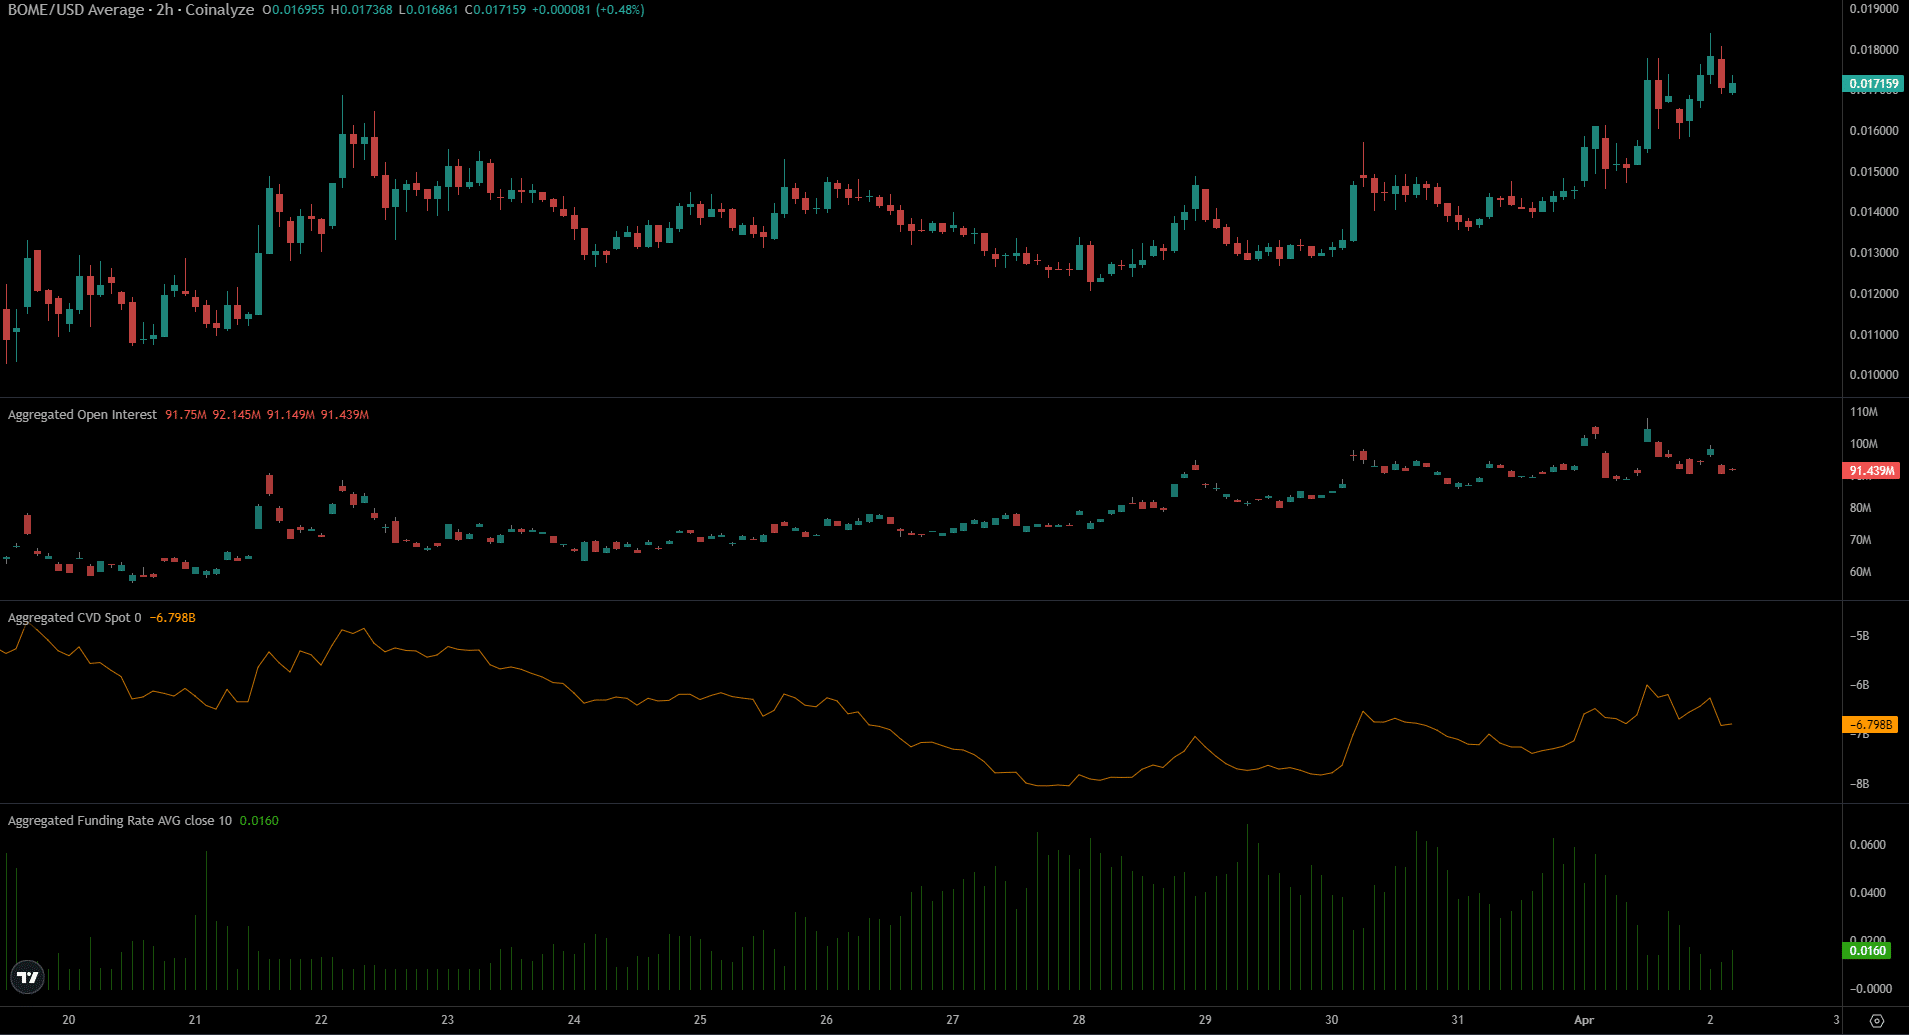
Funding Rates began to falter
The Open Interest behind BOME has not increased dramatically over the past five days, even though the price saw a steady short-term uptrend. This showed a lack of conviction among speculators.
Meanwhile, the demand in the spot market was consistent, based on the spot CVD’s uptick.
Is your portfolio green? Check out the BOME Profit Calculator
The Funding Rate began to slow down over the past couple of days alongside the OI.
Together, they showed that Futures traders unwilling to go long on BOME given the market conditions, even though its performance was bullish in the near term.
Disclaimer: The information presented does not constitute financial, investment, trading, or other types of advice and is solely the writer’s opinion.


