- $4.7 billion in BTC and ETH options are set to expire, potentially influencing market volatility.
- Technical analysis on the chart shows us possible price movements for Bitcoin and Ethereum following the options expiry
In the financial markets today, all eyes are on the cryptocurrency sector as it braces for a significant event.
Both Bitcoin [BTC] and Ethereum [ETH] have seen considerable fluctuations recently, with Bitcoin up by 1.4% and Ethereum gaining 0.7% over the past 24 hours with a current price of $68,223 and $3,733, respectively.
This activity is notable, especially as Ethereum has outperformed with a 23.3% increase over the past two weeks, likely boosted by the U.S. Securities and Exchange Commission’s recent approval of a spot ETF for the asset.
This has set the stage for today’s (31st May) main event: the expiry of a colossal $4.7 billion in notional value of BTC and ETH options contracts.
Decoding crypto options
Options in the cryptocurrency market function similarly to those in traditional finance, where traders are provided with the right, but not the obligation, to buy (call option) or sell (put option) an underlying asset at a specified price before the contract expires.
The Deribit platform’s data revealed an expected increase in market volatility triggered by today’s options expiry. This is underpinned by the substantial volume of both Bitcoin and Ethereum options set to close.
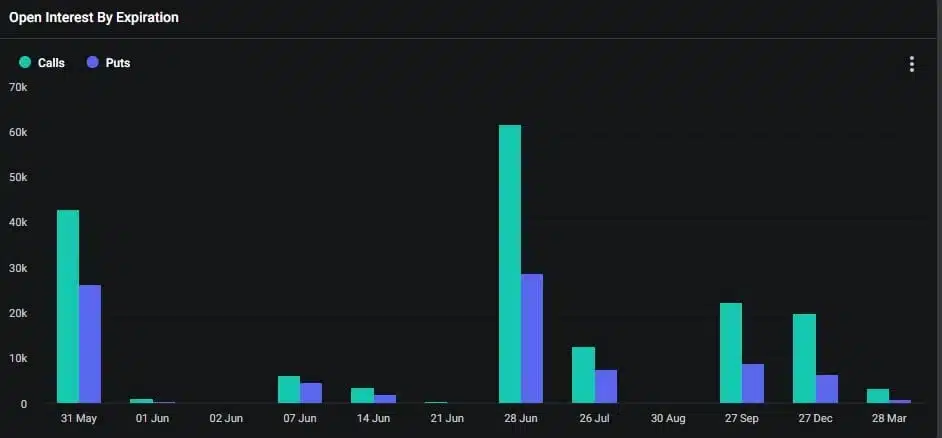
A detailed look at the options market shows a higher number of call options, indicating a bullish sentiment among traders. Specifically, the put/call ratio for Bitcoin stands at 0.61, suggesting a dominance of bullish contracts.
The max pain point, where option holders suffer maximum financial loss, is pegged around $66,000, which is considerably lower than the current trading prices.


Source: Deribit
Notably, options with strike prices ranging up to $100,000 carry a significant open interest, totaling a notional value of $886 million. This optimism is contrasted sharply on the downside by a substantial $519 million open interest at the $60,000 strike price.
Notably, the current notional value for BTC calls options stands at $2.9 billion.

Source: Deribit
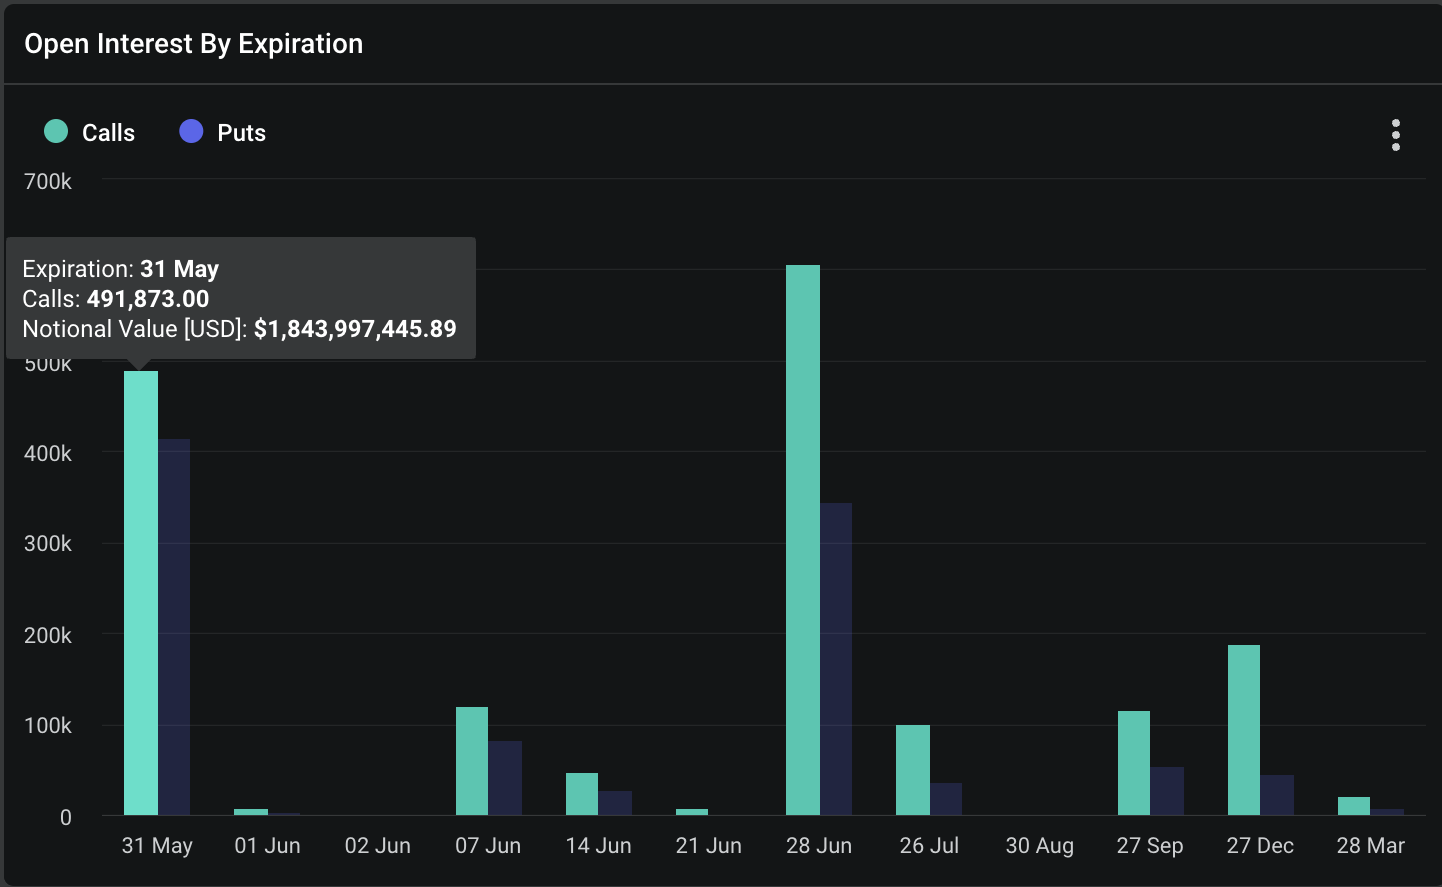
For Ethereum, the scenario is slightly different. The day sees about $1.8 billion in notional value of Ethereum call contracts expiring, with a put/call ratio of 0.84.
This ratio suggests a more balanced view among traders regarding Ethereum’s short-term price prospects. The open interest in Ethereum futures is also peaking near all-time highs, influenced by speculative trading following the ETF approval.

Source: Deribit
Technical analysis and market forecast
To understand how Bitcoin (BTC) and Ethereum (ETH) might react to today’s significant options expiry, a technical analysis of their respective charts is essential.
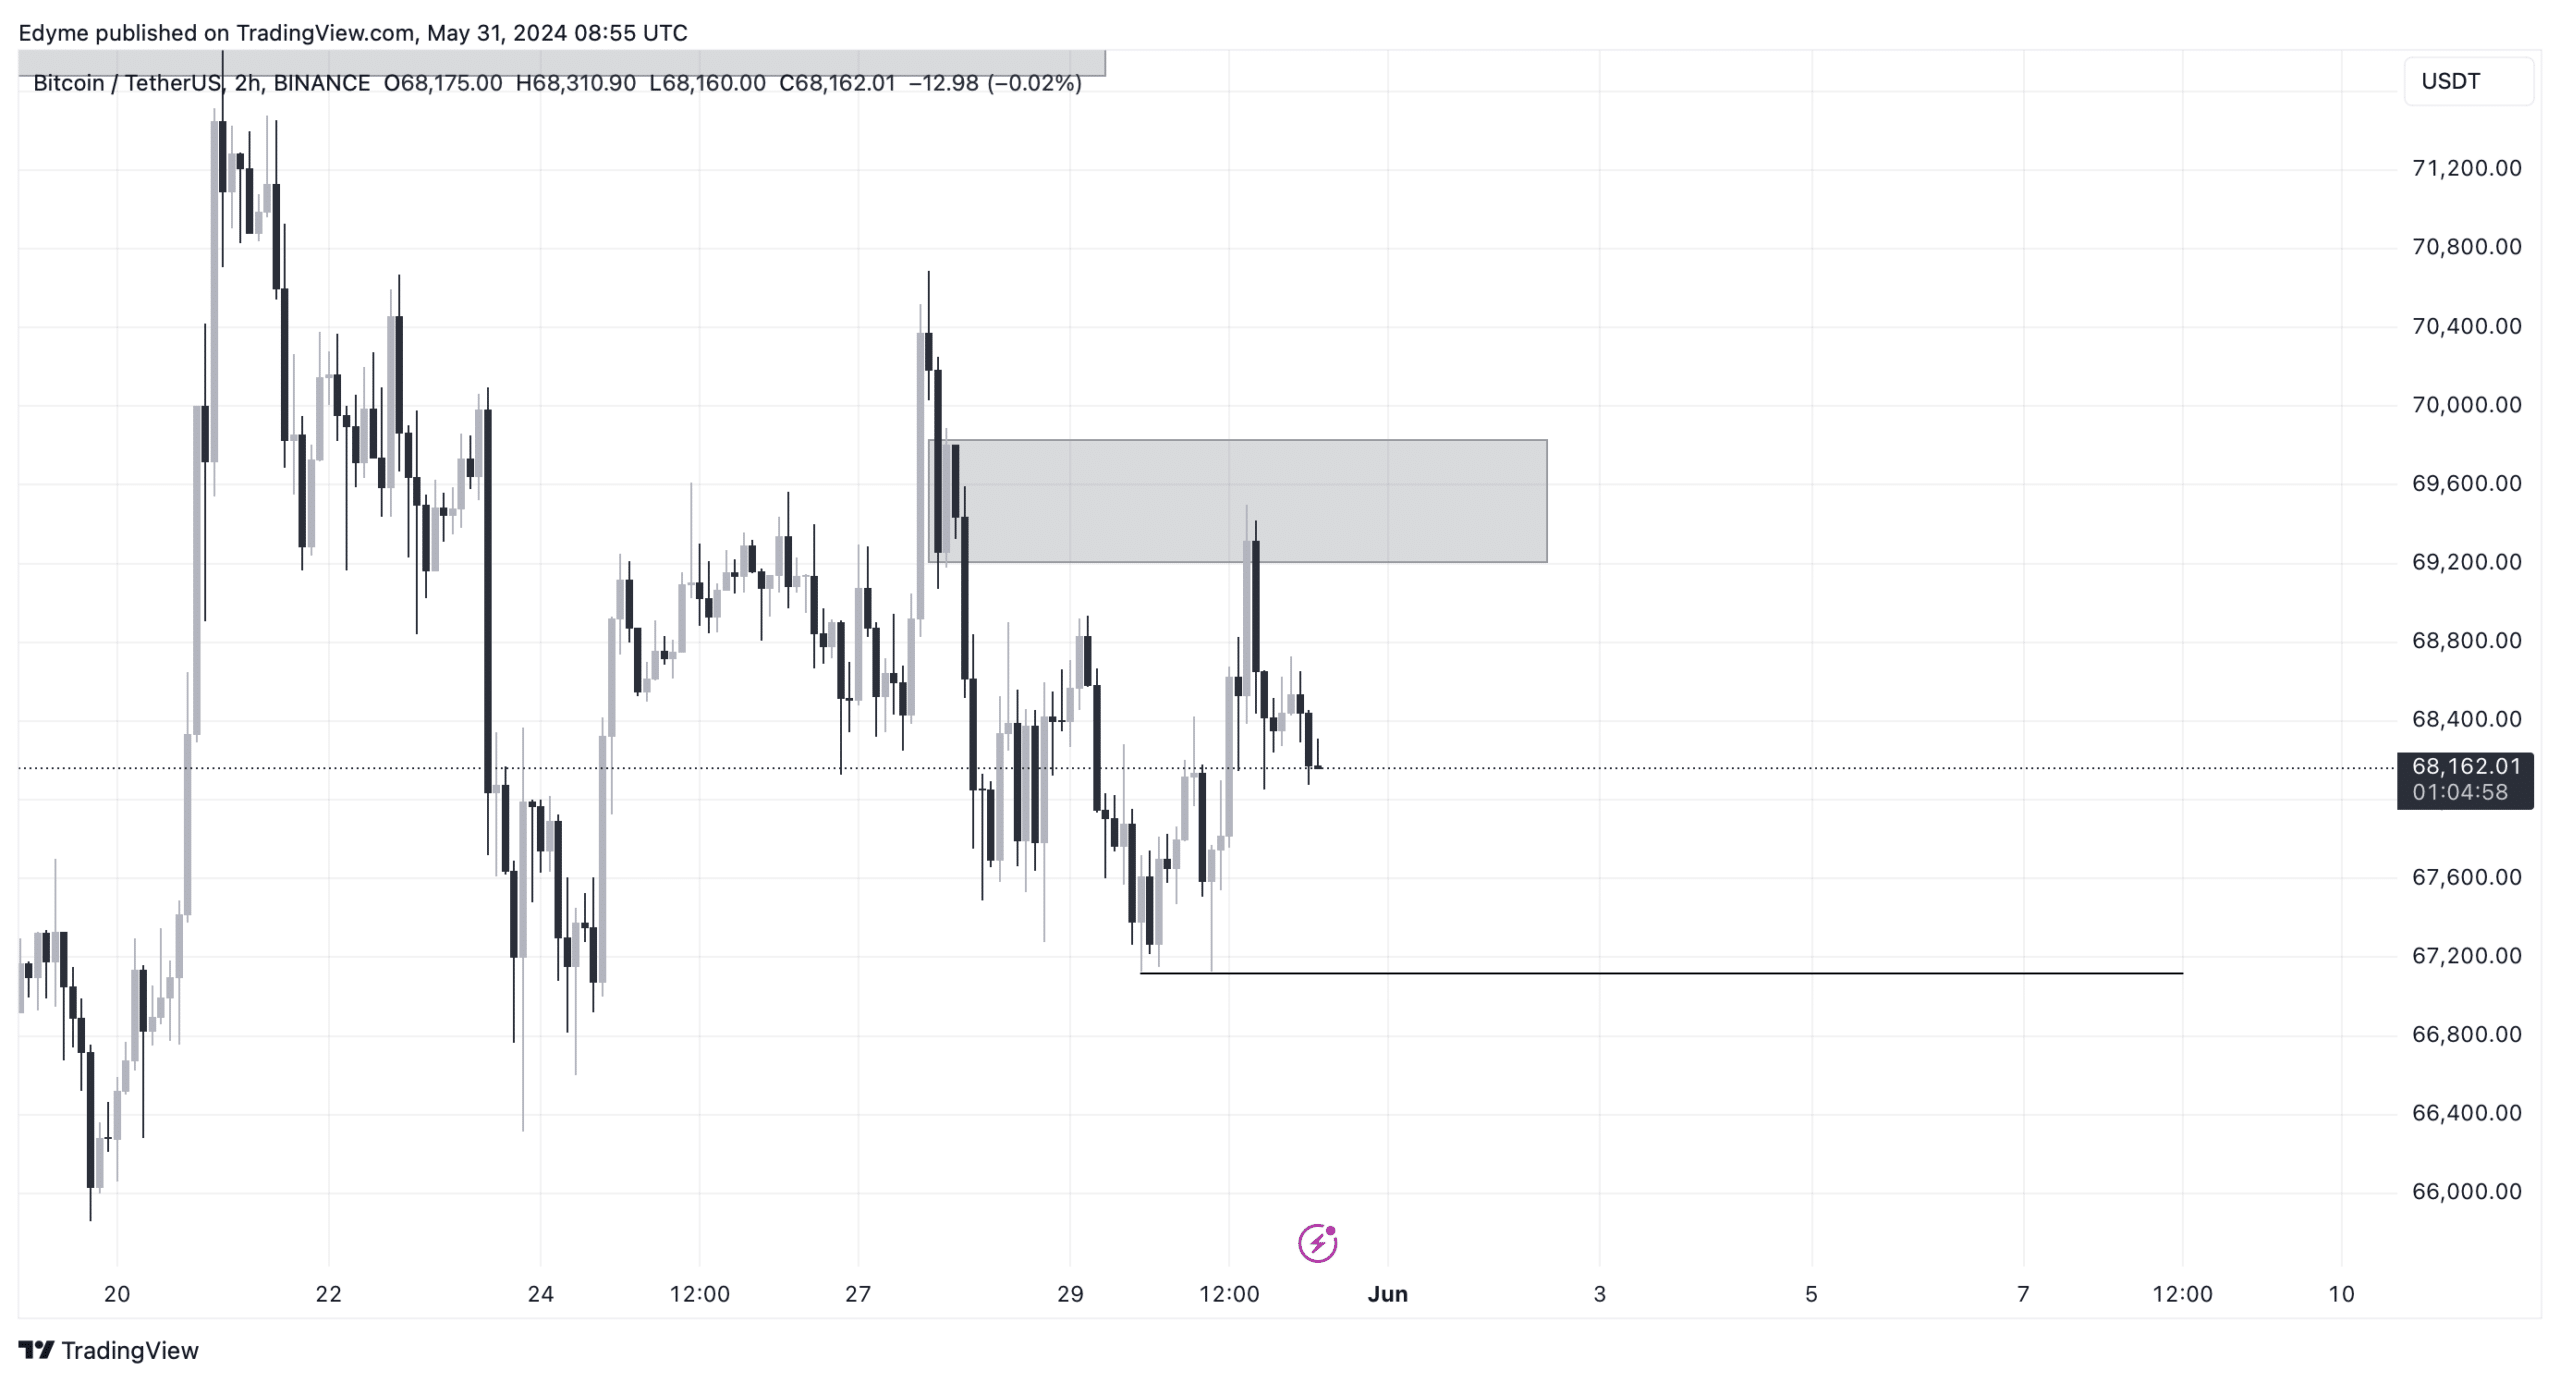
Starting with Bitcoin, the daily swing structure places BTC in a premium zone, typically a signal for potential selling to the discount zone before a reversal.
A closer look at lower time frames reveals that Bitcoin has recently encountered a critical supply zone on the 4-hour chart, suggesting possible downward pressure.
Although no substantial downward break has occurred post-testing this zone, the 2-hour chart confirms another test of a supply zone, hinting at a potential short-term decline to the $67,000 level, potentially marking the first structural break to the downside on the 4-hour chart.

Source: TradingView
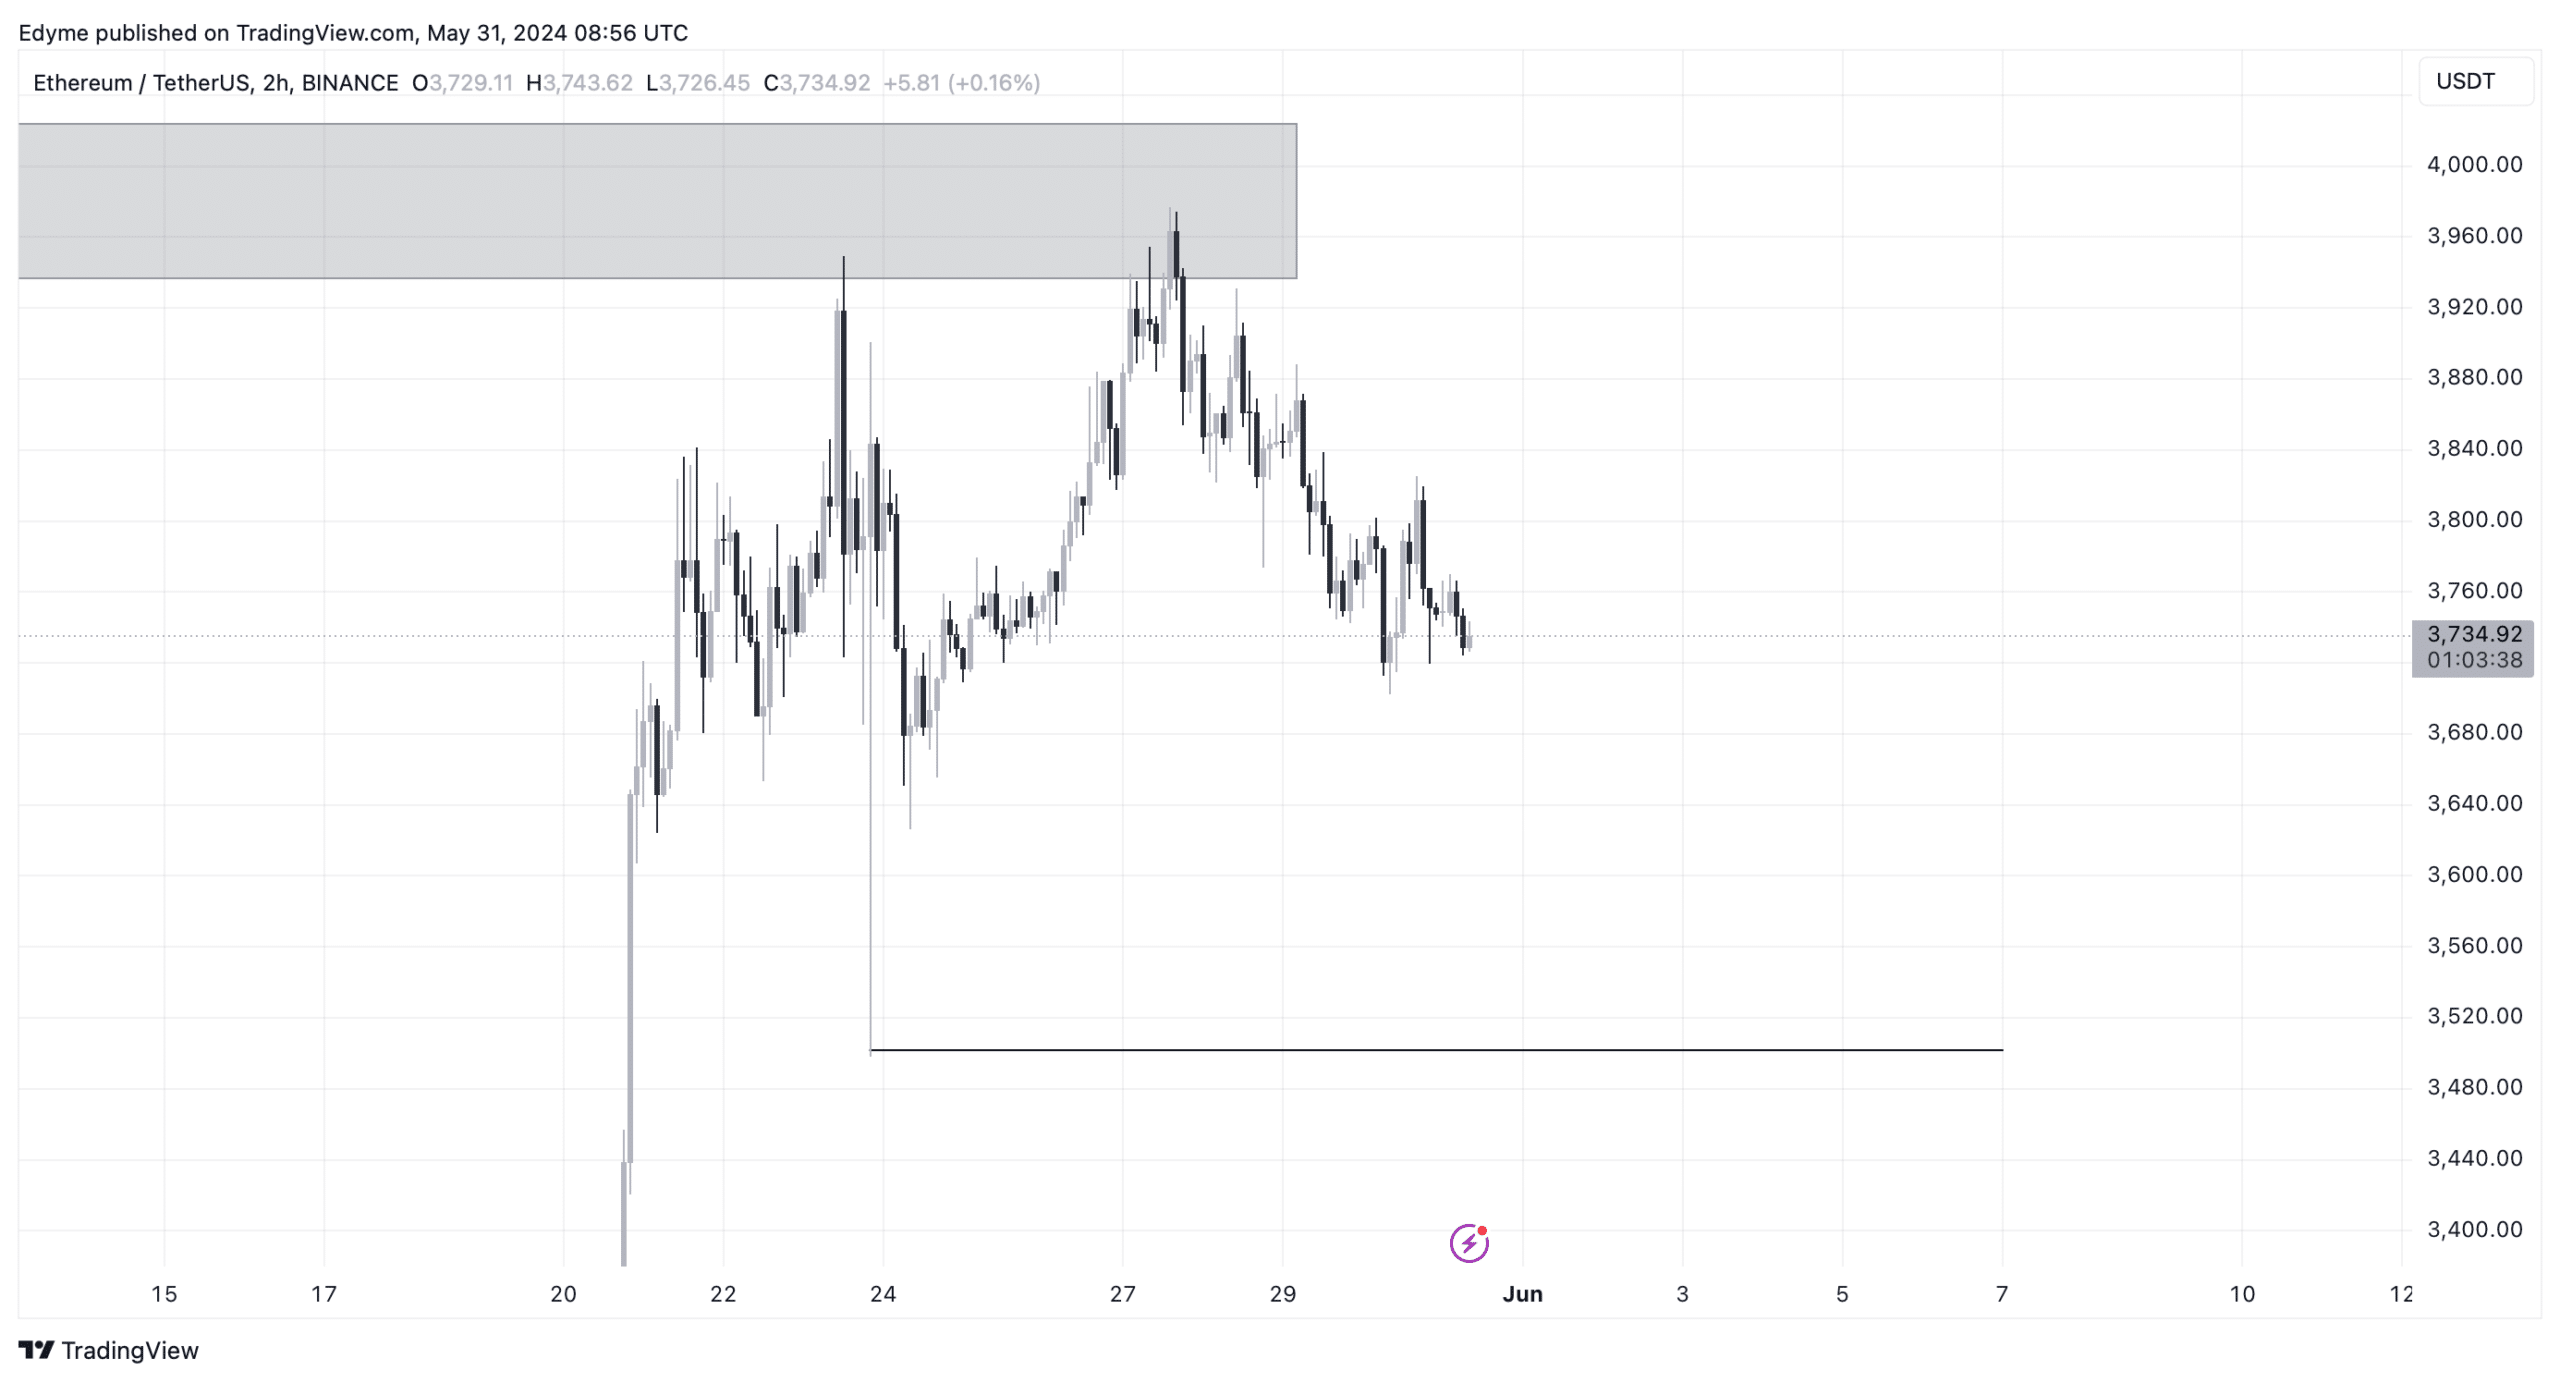
Similarly, Ethereum has tested a supply zone on its 4-hour chart, indicating a possible downtrend as it remains in the premium zone on the daily chart.
The asset’s 2-hour chart shows minor structural breaks downward, suggesting a continued downtrend toward the $3,500 level.

Source: TradingView
In the backdrop of these technical movements, both cryptocurrencies have already inflicted losses on some traders.
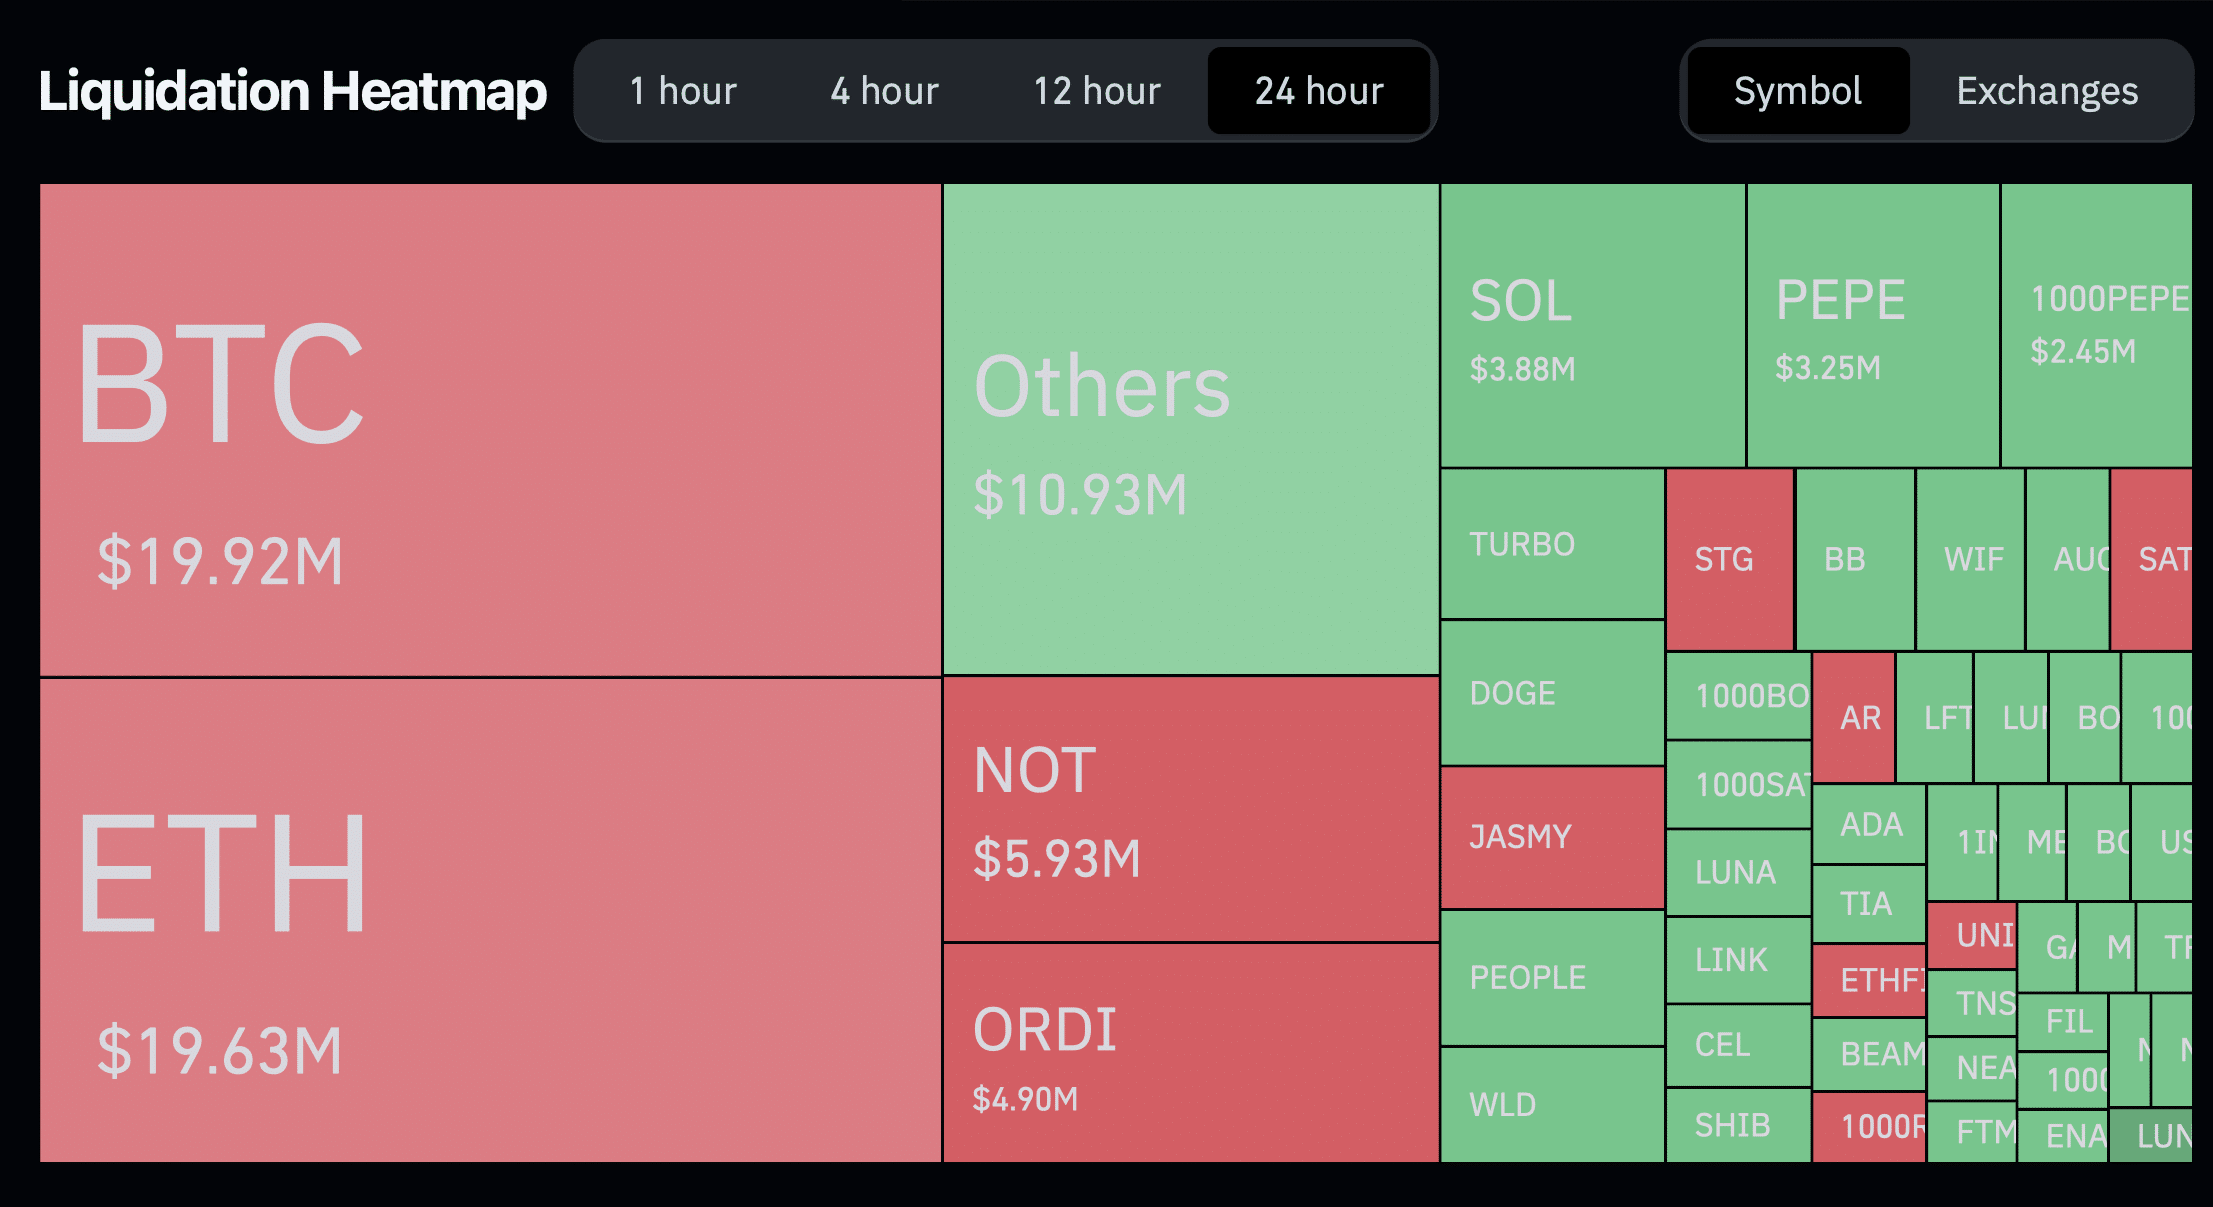
According to Coinglass, Bitcoin traders have faced $19.92 million in liquidations, while Ethereum traders have seen approximately $19.63 million in liquidations.

Read Bitcoin (BTC) Price prediction 2024-25
Furthermore, an AMBCrypto report notes that the Relative Strength Index (RSI) and Money Flow Index (MFI) for Bitcoin are at 53.85 and 57.94, respectively.
These figures indicate a balanced market where neither buyers nor sellers have dominant control, leading to continued price consolidation or range-bound movements.


