- Ethereum loses ultrasound money status.
- Total supply has increased by over 100,000.
Ethereum [ETH] has transitioned from being labeled “ultrasound money” due to the EIP-1559 upgrade, which has altered its deflationary characteristics.
This upgrade reduced Ethereum’s burn rate, leading to a slowdown in the rate at which Ether is removed from circulation.
The total supply of ETH has increased, and there has been a recent rise in the supply of ETH on exchanges. How does the supply on exchanges compare to the total supply?
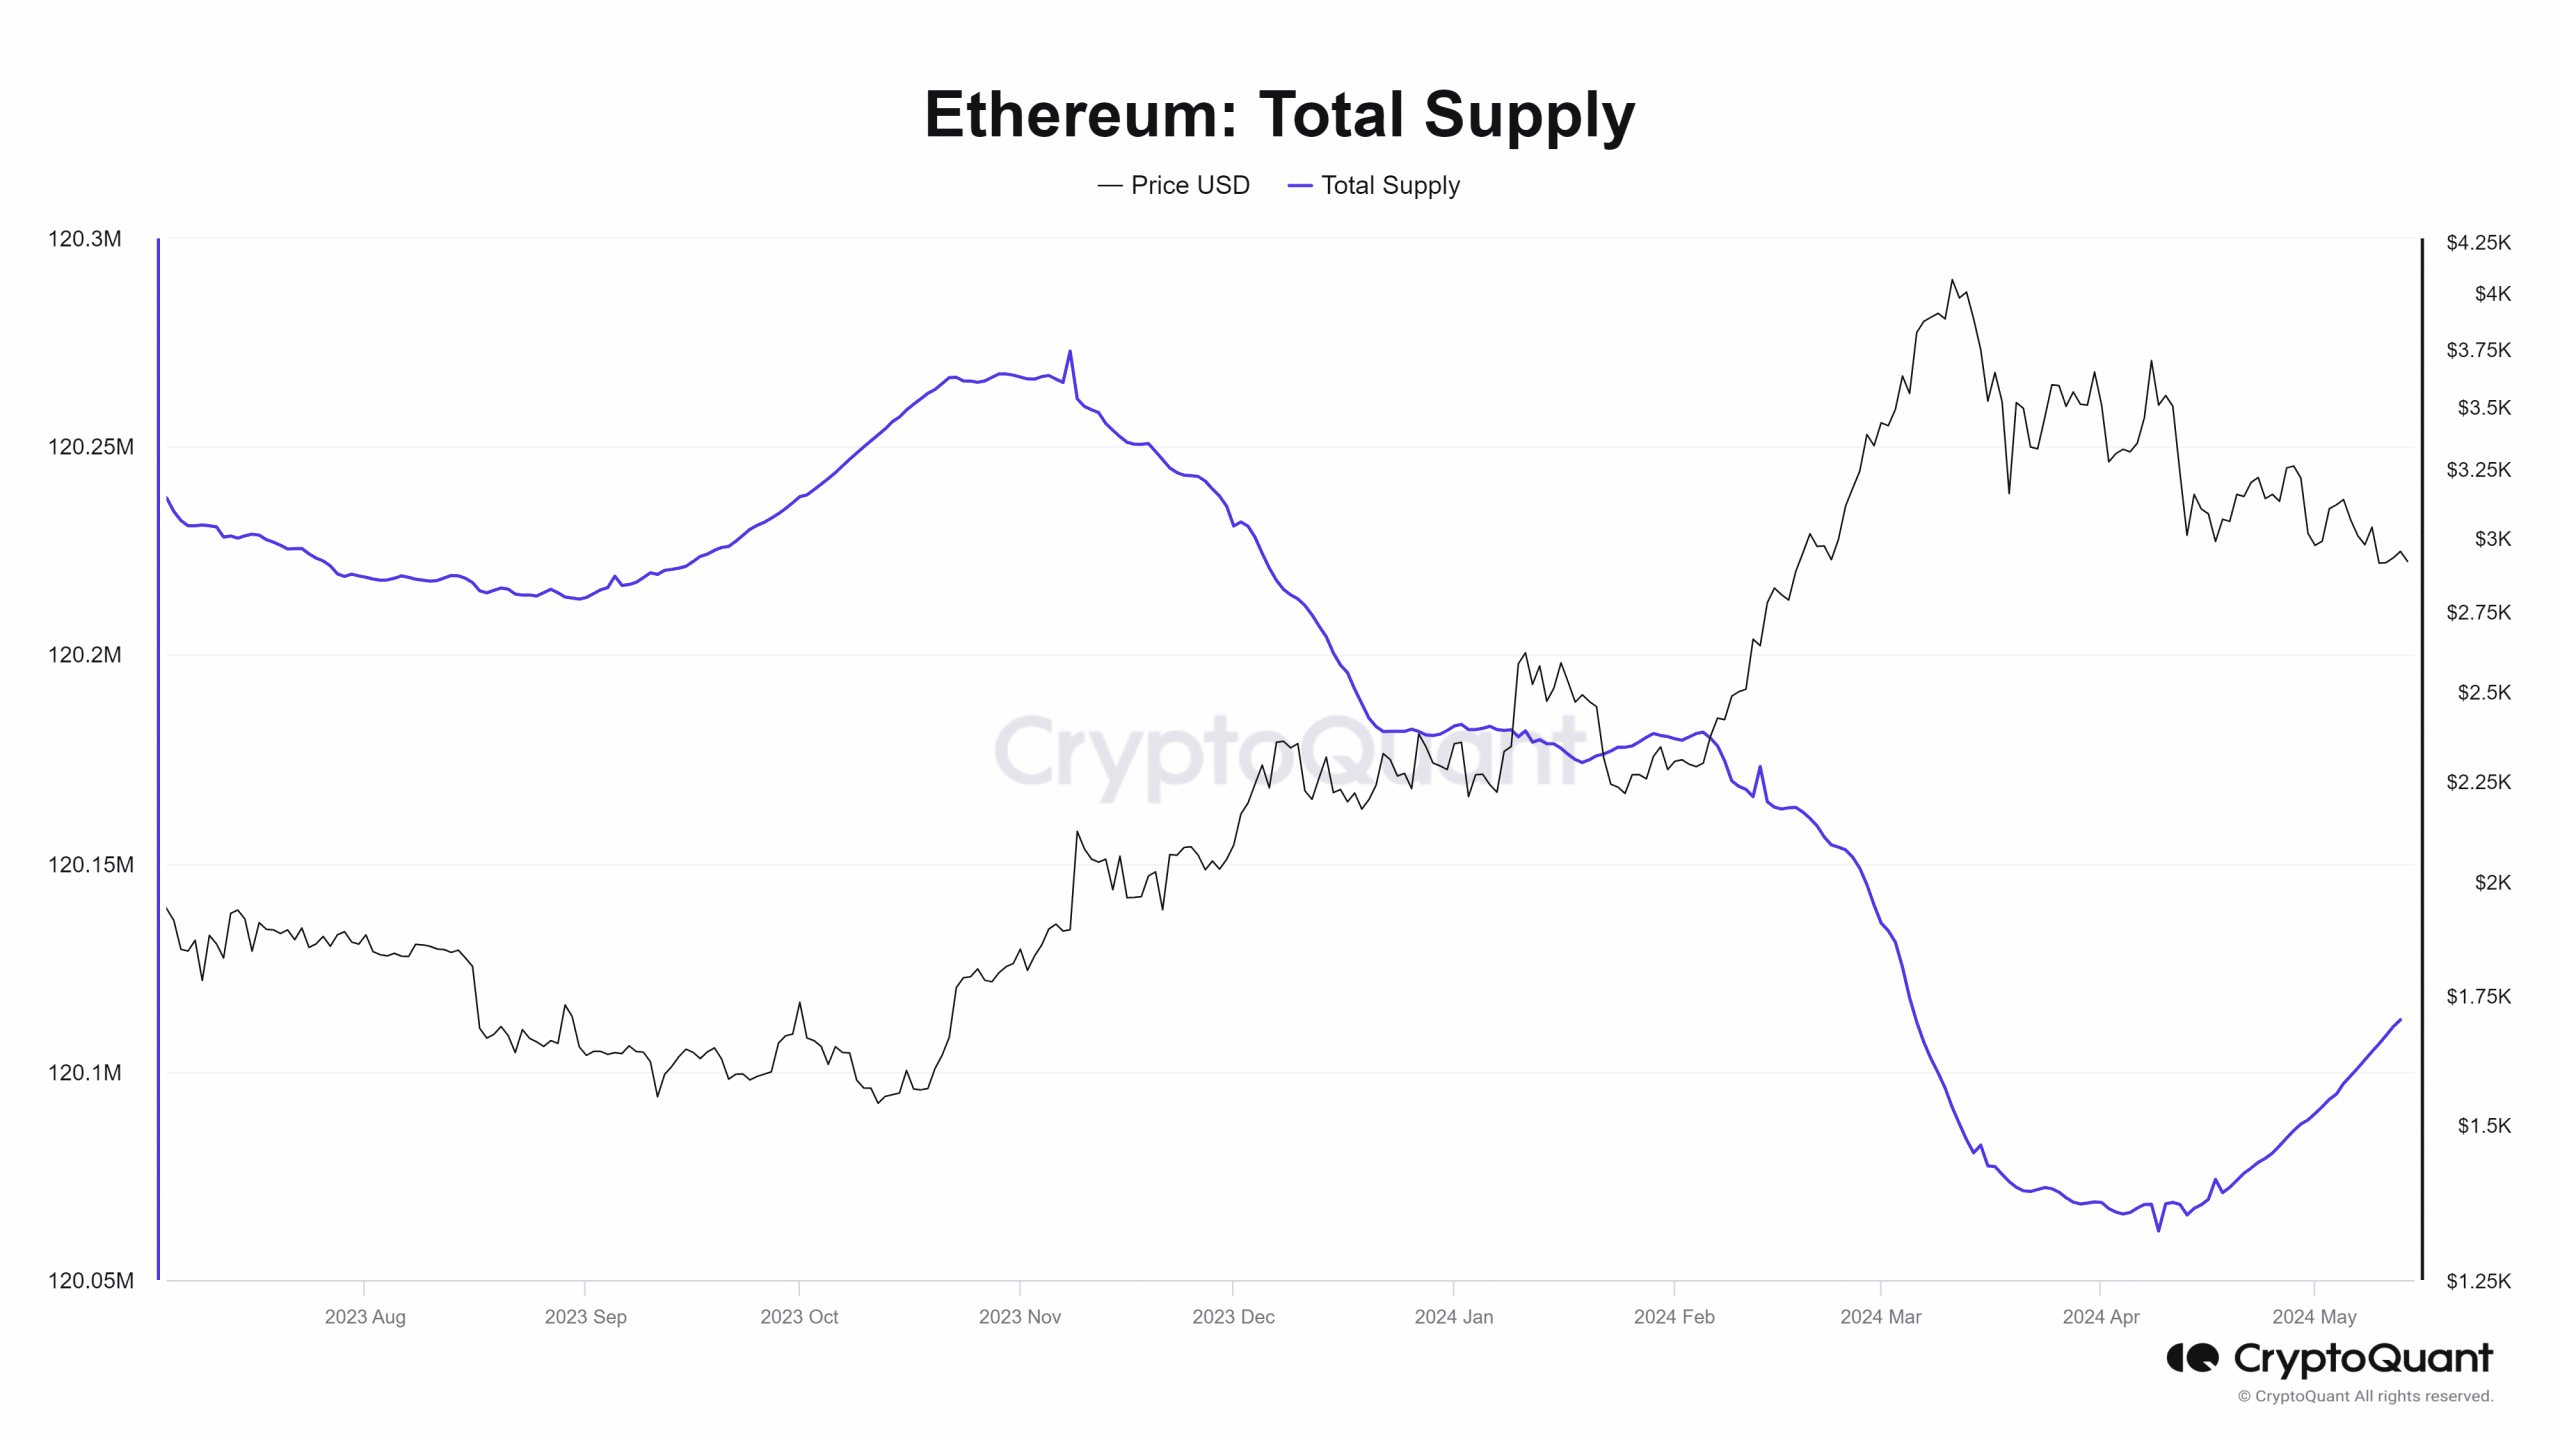
Ethereum total supply and fees burnt display contrasting trends
The analysis of Ethereum’s supply metric on CryptoQuant reveals notable fluctuations in total supply dynamics over recent months.
From November 2023 to early April 2024, there was a discernible decrease in ETH’s total supply, dropping from over 120.2 million to approximately 120.06 million, marking a reduction of over 100,000 Ether.


Source: CryptoQuant
However, beginning from the 19th of April, Ethereum’s total supply started to ascend, reaching around 120.1 million at the time of this analysis.
This recent increase in total supply is attributed to a decline in the fees burnt, which commenced following the Dencum upgrade.
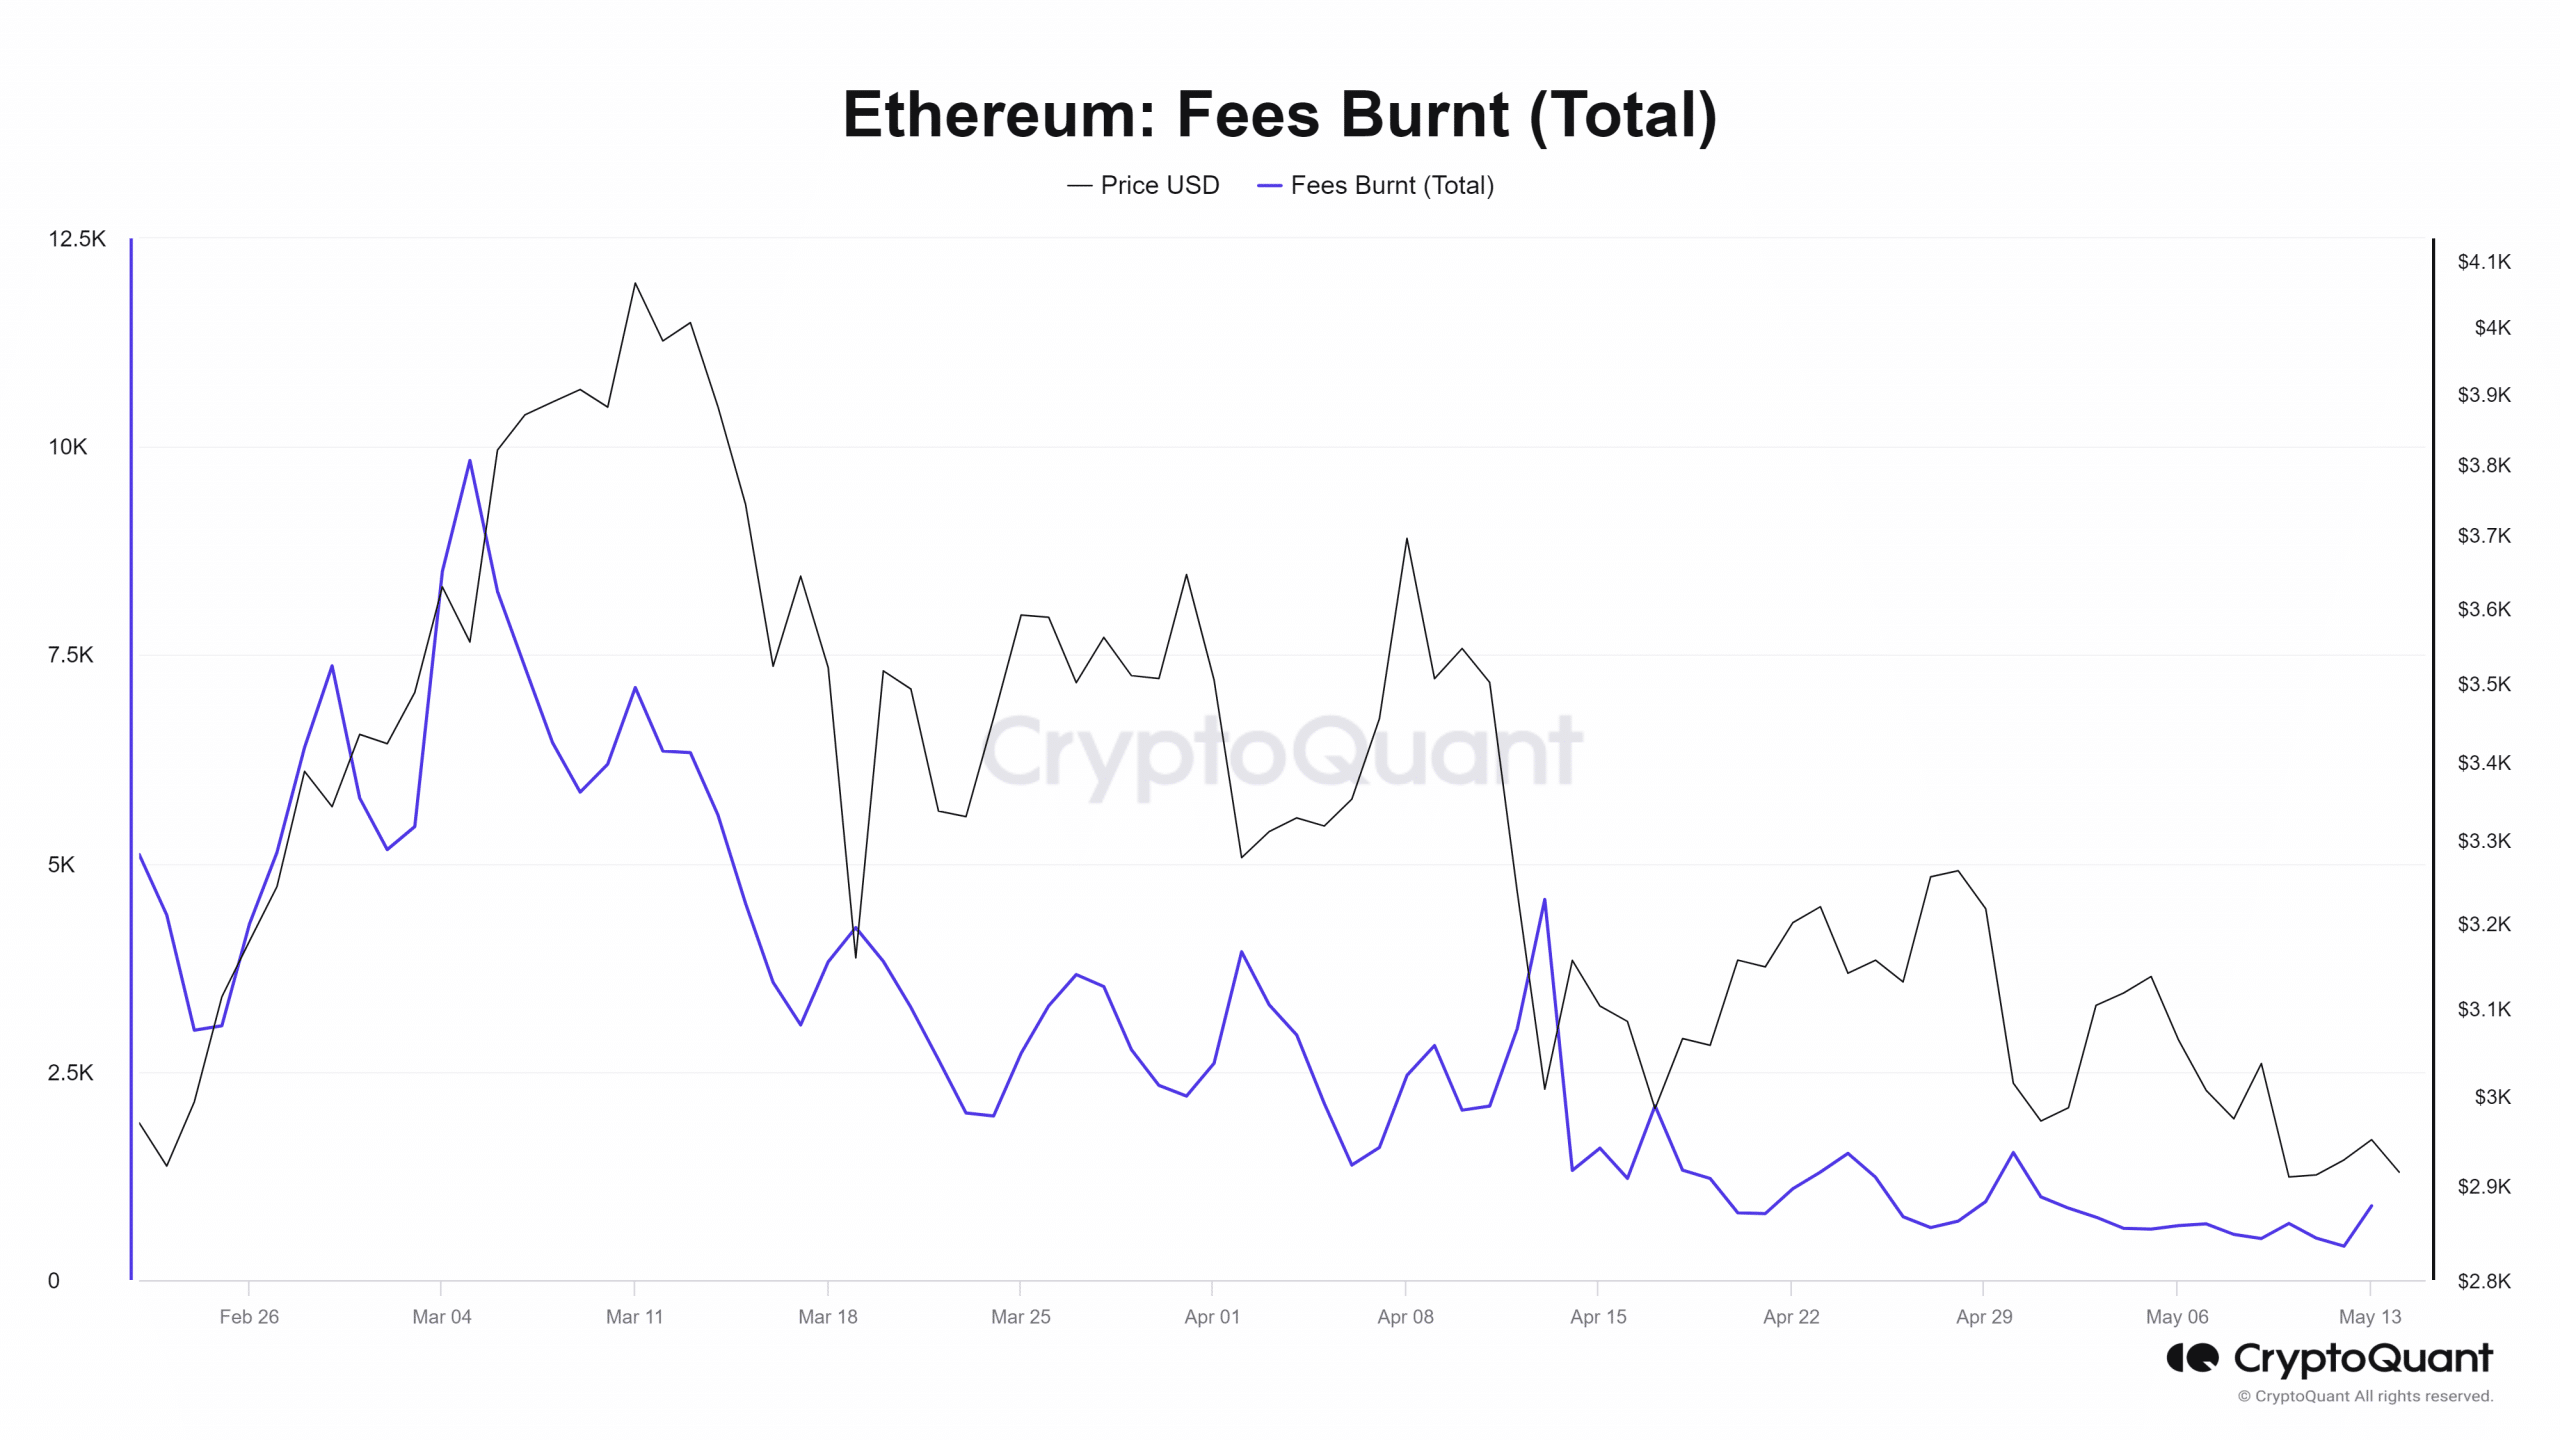
An examination of the fees burnt metric illustrates a significant decrease, starting around March.
During this period, fees burnt were approximately 6,000 Ether, contrasting sharply with the current value of around 890 ETH at the time of this analysis.
This significant reduction in fees burnt accounts for the observed uptick in Ethereum’s total supply, indicating a shift in its deflationary dynamics.
Also, the decline in fees burn is due to the decline in fees on the network.


Source: CryptoQuant
Ethereum sees a decline in overall fees
The recent Ethereum upgrade has led to a reduction in transaction fees, both on the main network and its Layer 2 solutions.
Data from Coin98 Analytics indicated that Ethereum transaction fees has reached a yearly low, averaging 0.00017E, which translates to approximately $0.5 per transaction.
This fees marks a significant decrease compared to levels observed around February.
Furthermore, analysis of the overall fees generated on the Ethereum network revealed a noticeable decline in recent times.
As of this writing, the total fees were around $3.6 million, contrasting sharply with the peak recorded in March, which stood at approximately $7.8 million.
This downward trend in fees commenced about a month ago.
Ethereum supply on exchanges climbs
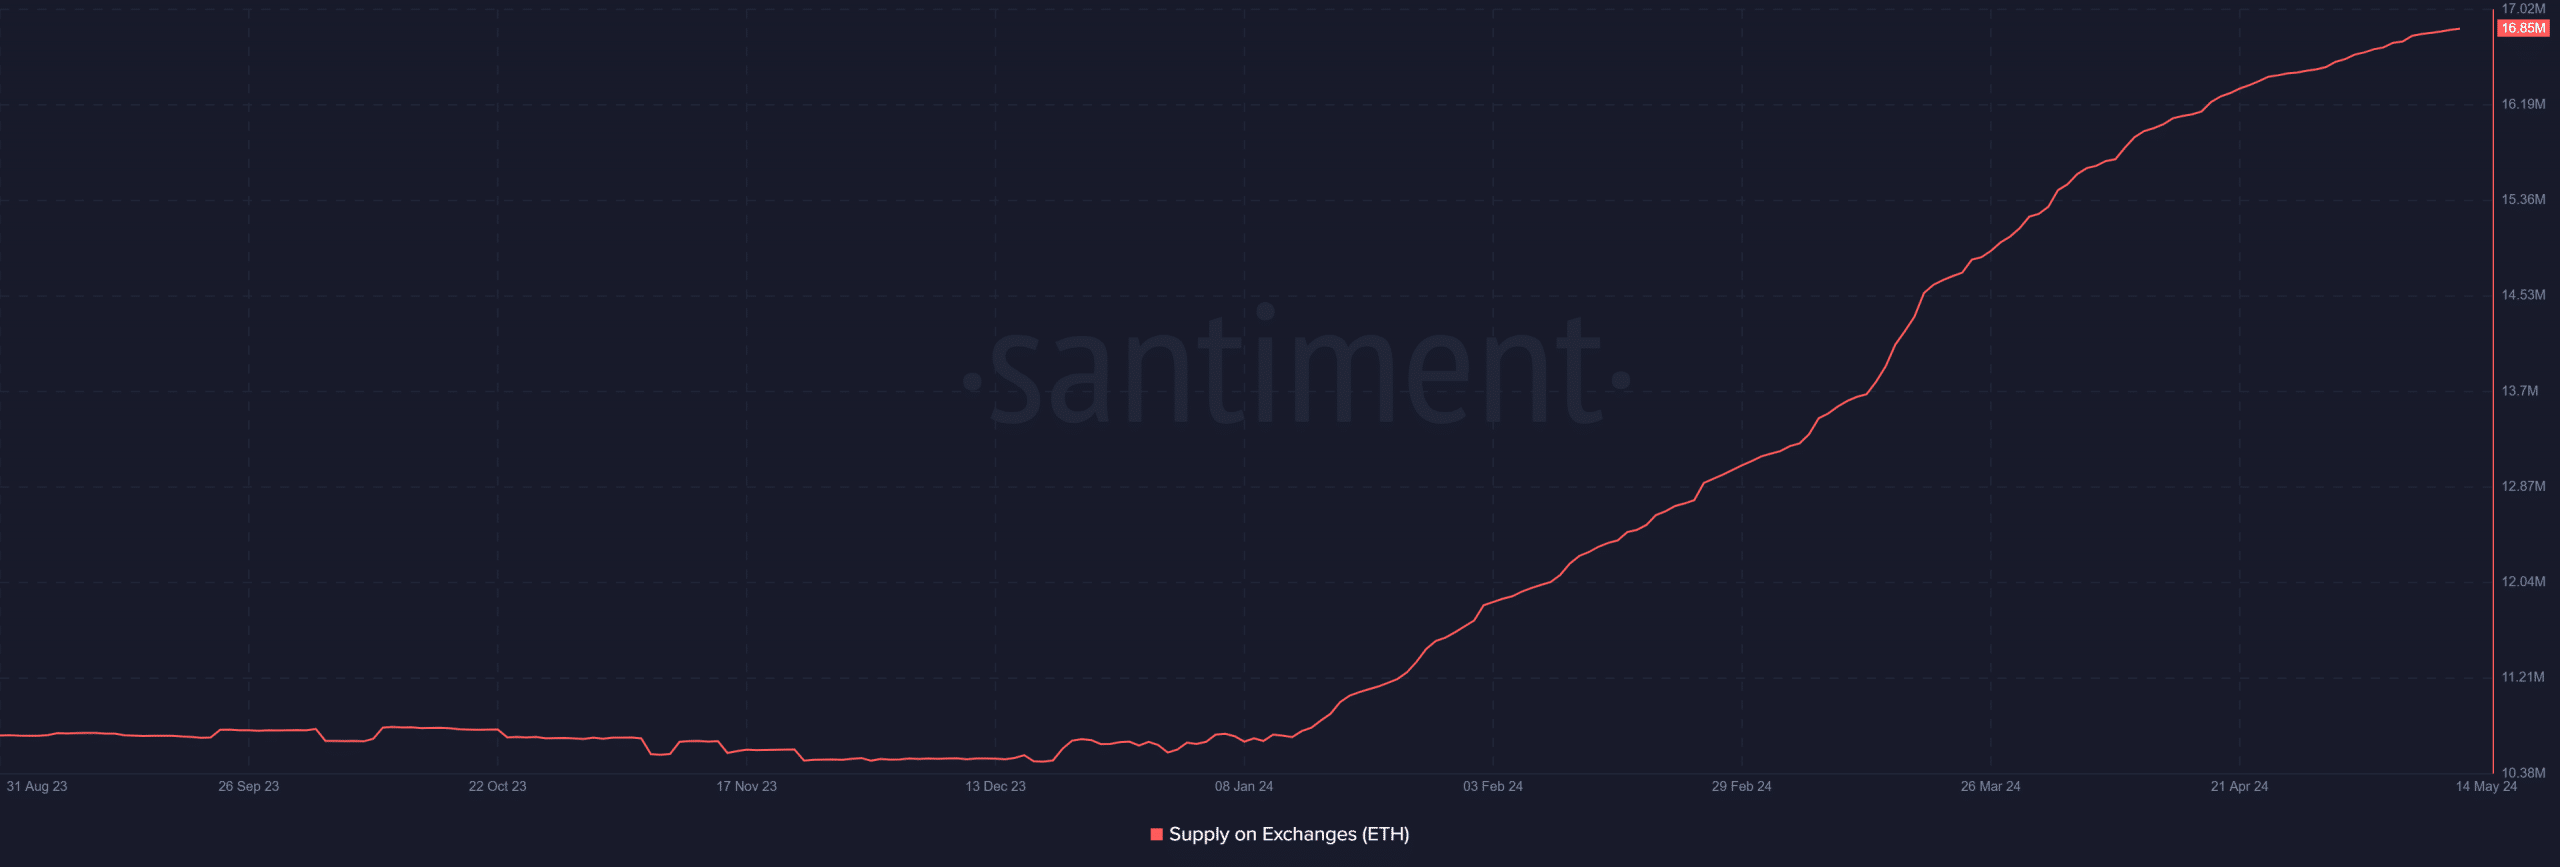
Analysis of the Ethereum exchange supply indicates a notable upward trend, albeit with some interesting nuances.
The increase in exchange supply began before the total supply started to rise, with the growth, observed between March and press time, amounting to over 3 million Ether.
As of this writing, the total exchange supply was over 16.8 million.


Source: Santiment
Despite this significant growth, the exchange supply remained relatively low compared to the total supply of Ethereum. This suggests that Ethereum is facing a manageable risk of oversupply.
Furthermore, the proportionately low exchange supply indicates that the current price of Ethereum is not under immediate threat from inflationary pressures.
ETH continues to trend below $3,000
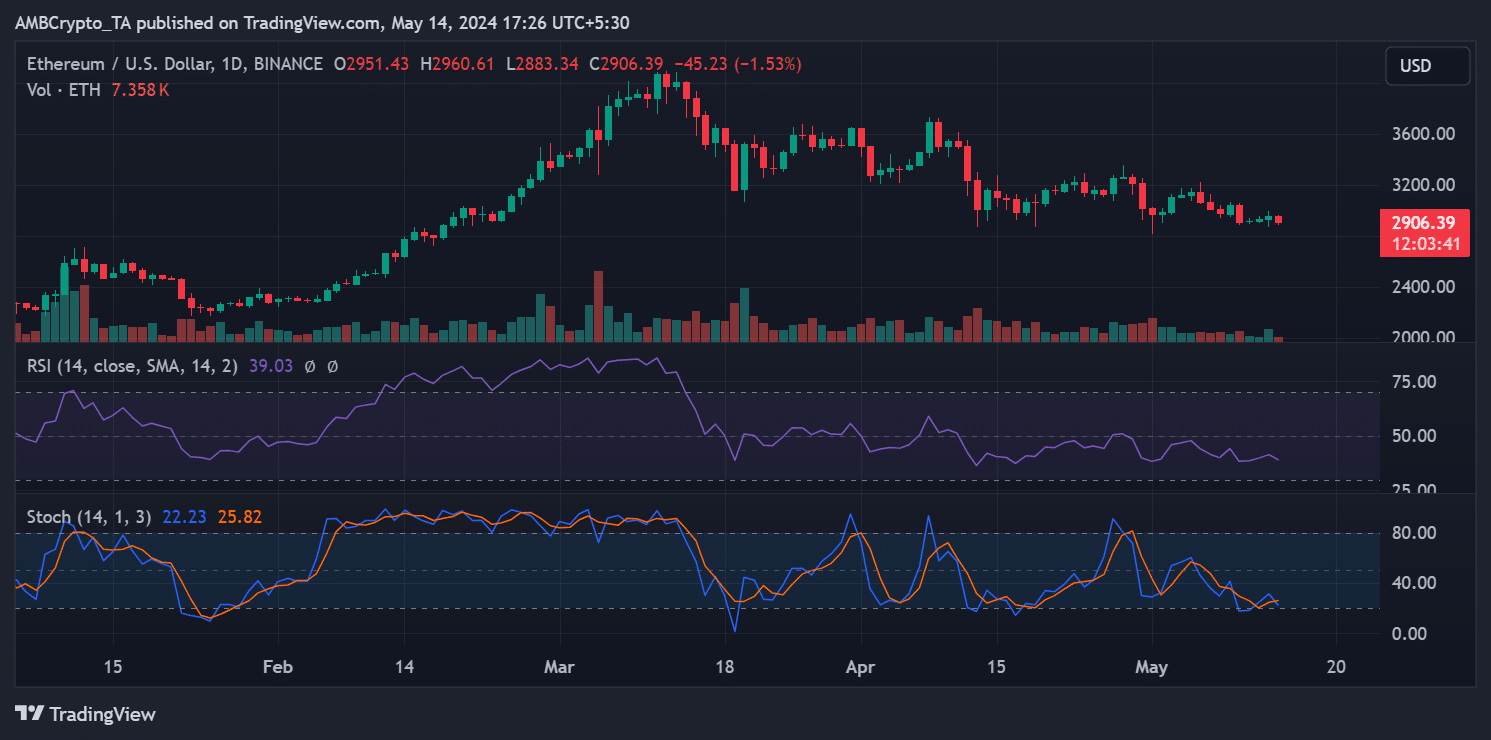
Analysis of the Ethereum price trend on the daily timeframe is reflecting a challenging period. Following its drop below the $3,000 price level in the previous week, ETH has struggled to regain its footing.
As of this writing, it was trading at around $2,900, experiencing a decline of approximately 1.5%.


Source: TradingView
Read Ethereum (ETH) Price Prediction 2024-25
Both the Stochastic indicator and the Relative Strength Index (RSI) were signaling a negative price trend. The RSI, in particular, indicated a bearish trend as it remained below the neutral line.
However, the current position of these indicators suggested a potential price reversal in the near future, with ETH poised for a possible uptick.


