- Legendary trader Peter Brandt believes Ethereum’s price chart is ‘intriguing’
- Ethereum’s price showed signs of recovery, with an increase in new addresses
Ethereum has so far exhibited a volatile mix of price movements, initially dipping below the $3,000-threshold in recent days before rallying above it once again.
This price behavior has caught the attention of traders and investors alike, with the asset appreciating by a 1.4% in the early hours of Friday. This recovery signifies a pivotal moment for Ethereum as it strives to maintain its momentum above this key price level.
Analyzing Ethereum’s chart patterns and broader market sentiment
Amidst these fluctuations, Peter Brandt, a seasoned trader with decades of experience in the financial markets, took to the social media platform X to express his views on Ethereum’s current price chart, which he described as “intriguing.” His analysis has sparked a wide array of discussions among the trading community.
Brandt’s examination of Ethereum’s price chart revealed two potential patterns – A flag and a channel. Initially, he interpreted the formation as a flag, which is typically seen as a continuation pattern that appears during brief pauses in dynamic market trends.
However, upon further analysis, Brandt suggested that the pattern might better resemble a channel.


Source: X
This structure is defined by two parallel, sloping lines, with the price testing each boundary at least twice. Despite the ambiguity in defining the exact pattern, Brandt highlighted the potential for a breakout in either direction, indicating a neutral position towards the immediate future of Ethereum’s price movements.
This neutrality is mirrored in the broader market sentiment.
For instance, data from Santiment indicated that the sentiment towards top cryptocurrency assets remains “negative,” a trend that has been persistent since the Bitcoin halving took place on 19 April. This episode failed to catalyze a significant increase in market caps across the sector.


Source: Santiment
This overarching mood suggests that while immediate gains are possible, the market remains cautious about the longer-term prospects.
Signs of recovery and technical outlook
Despite the prevailing bearish sentiment, however, there are signs of potential recovery on the horizon.
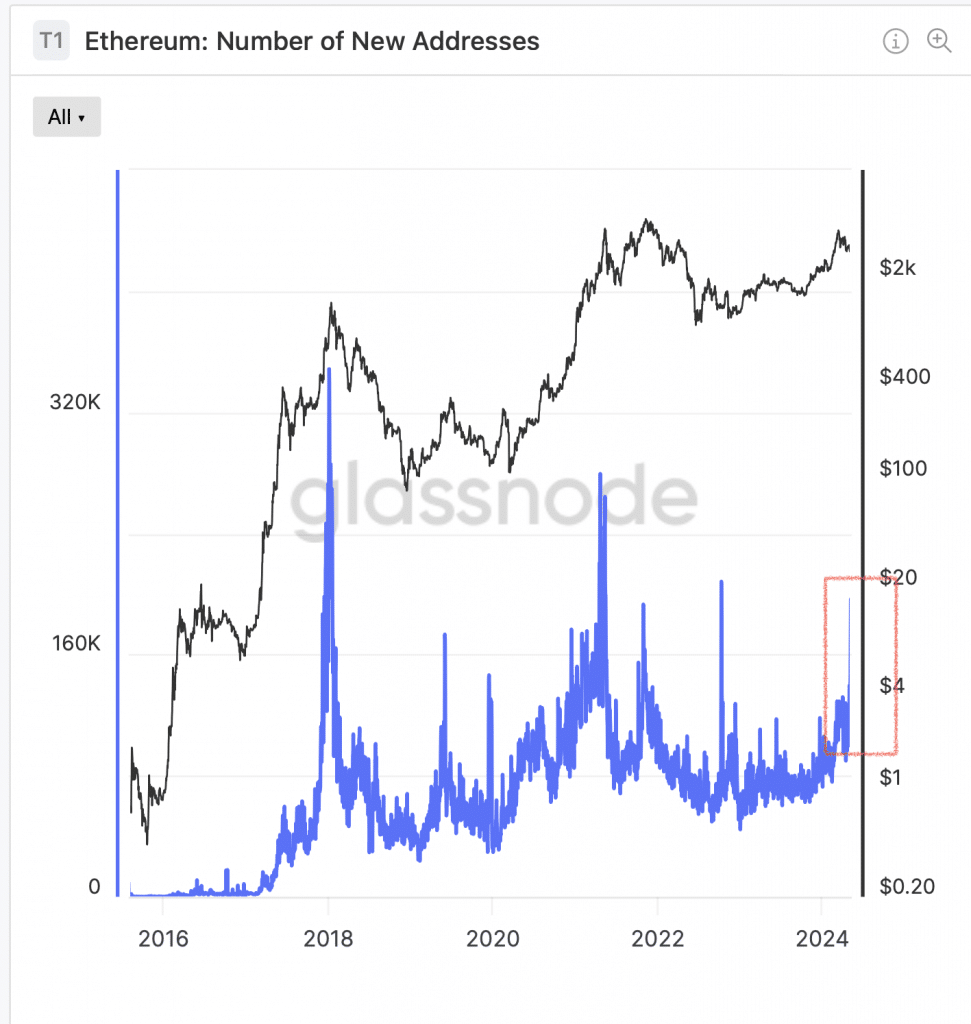
According to Glassnode data, the number of new Ethereum addresses has surged, climbing above 160,000 from its lows below 100,000 earlier in January.


Source: Glassnode
This uptick in new addresses could be a bullish signal for Ethereum, indicating greater interest and potential investment in the asset, despite its recent struggles.
From a technical perspective, the daily chart for Ethereum still highlighted a bearish trend at press time, with sustained breaks of structure to the downside. However, a closer look at the 4-hour chart revealed that Ethereum could see short-term upward movement. This potential hike could be a strategic move by the market to take out liquidity at higher levels, before continuing the prevailing downtrend.


Source: ETH/USDT, TradingView
Additional analysis from AMBCrypto supported this view, noting increased volatility in Ethereum’s price movements, as indicated by the Bollinger Bands.
Finally, the Relative Strength Index (RSI) had a reading of 40, reinforcing the strong bearish sentiments in the market.


