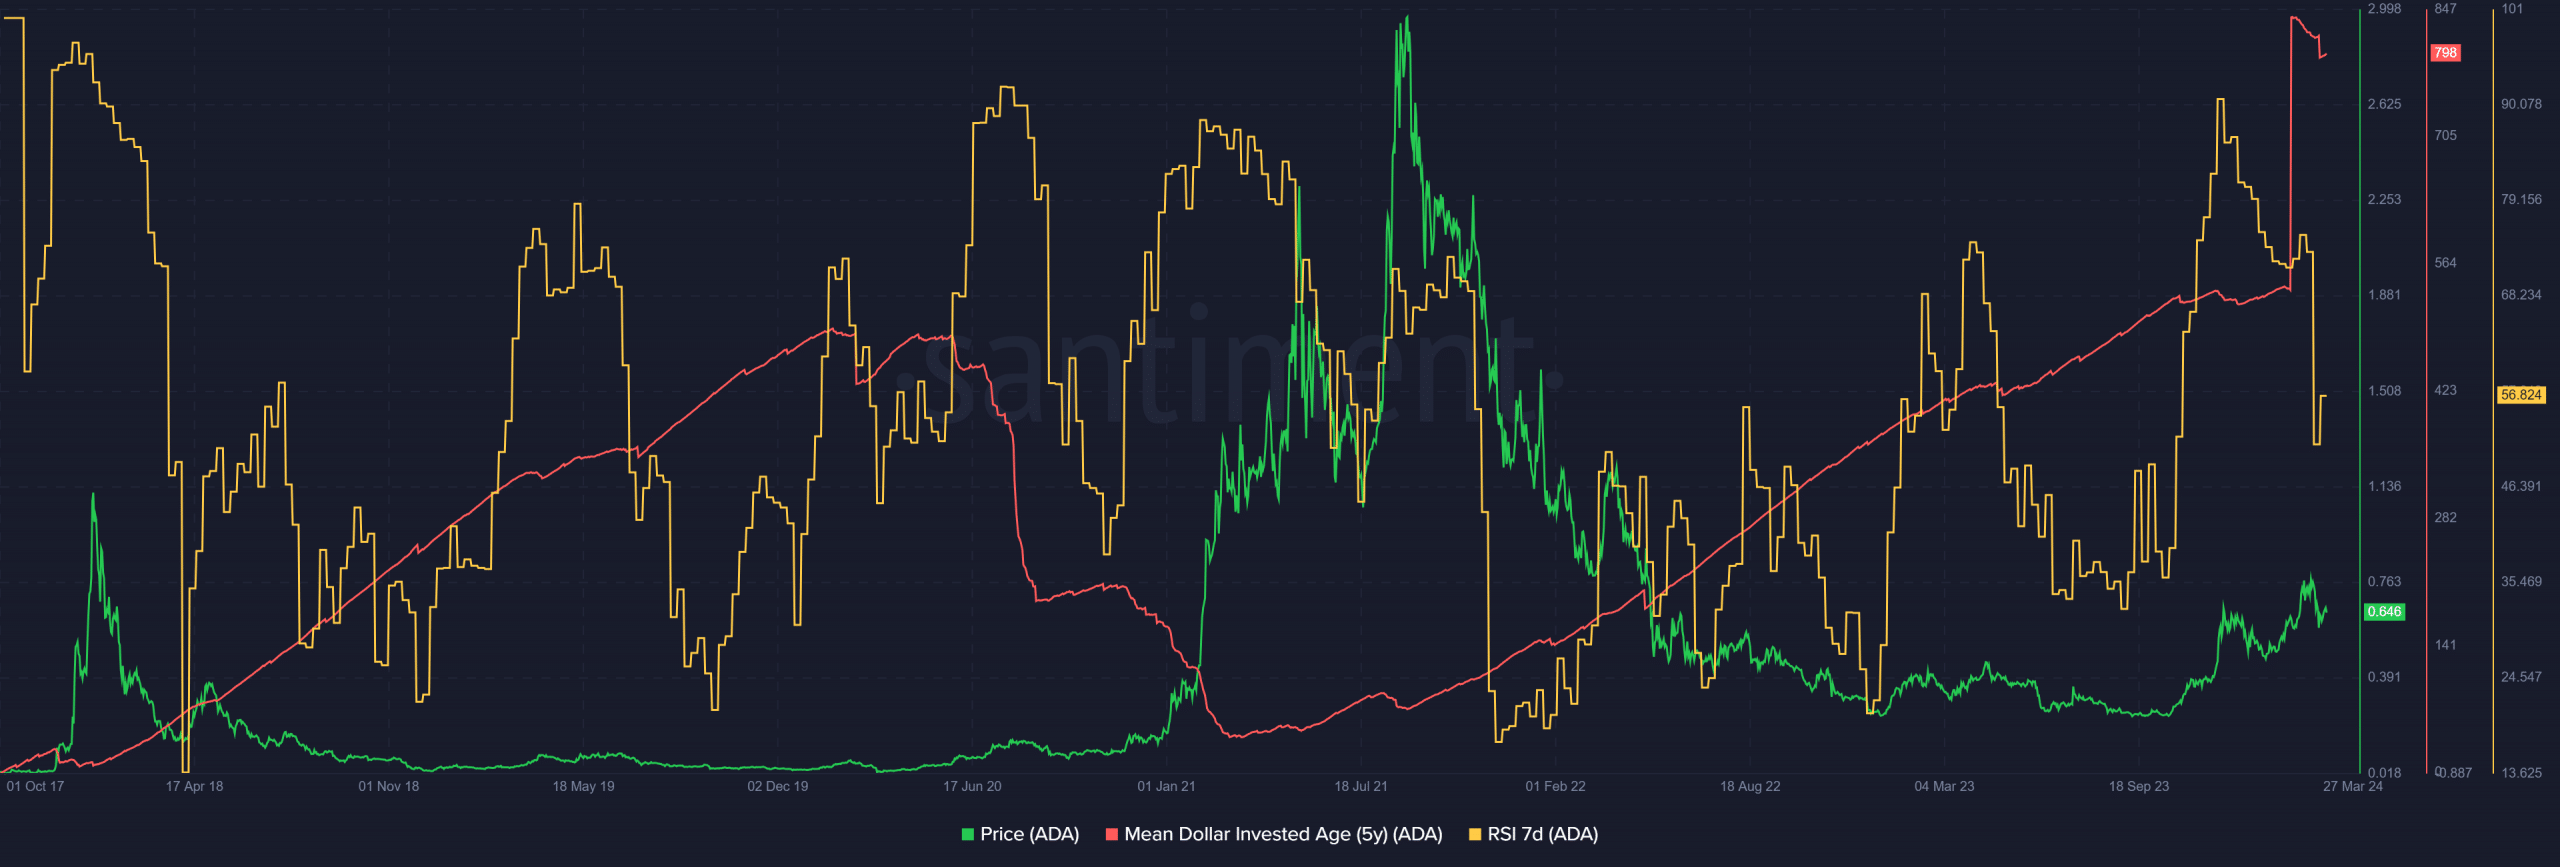
- Stagnant ADA tokens decreased, which is a bullish sign for the long term.
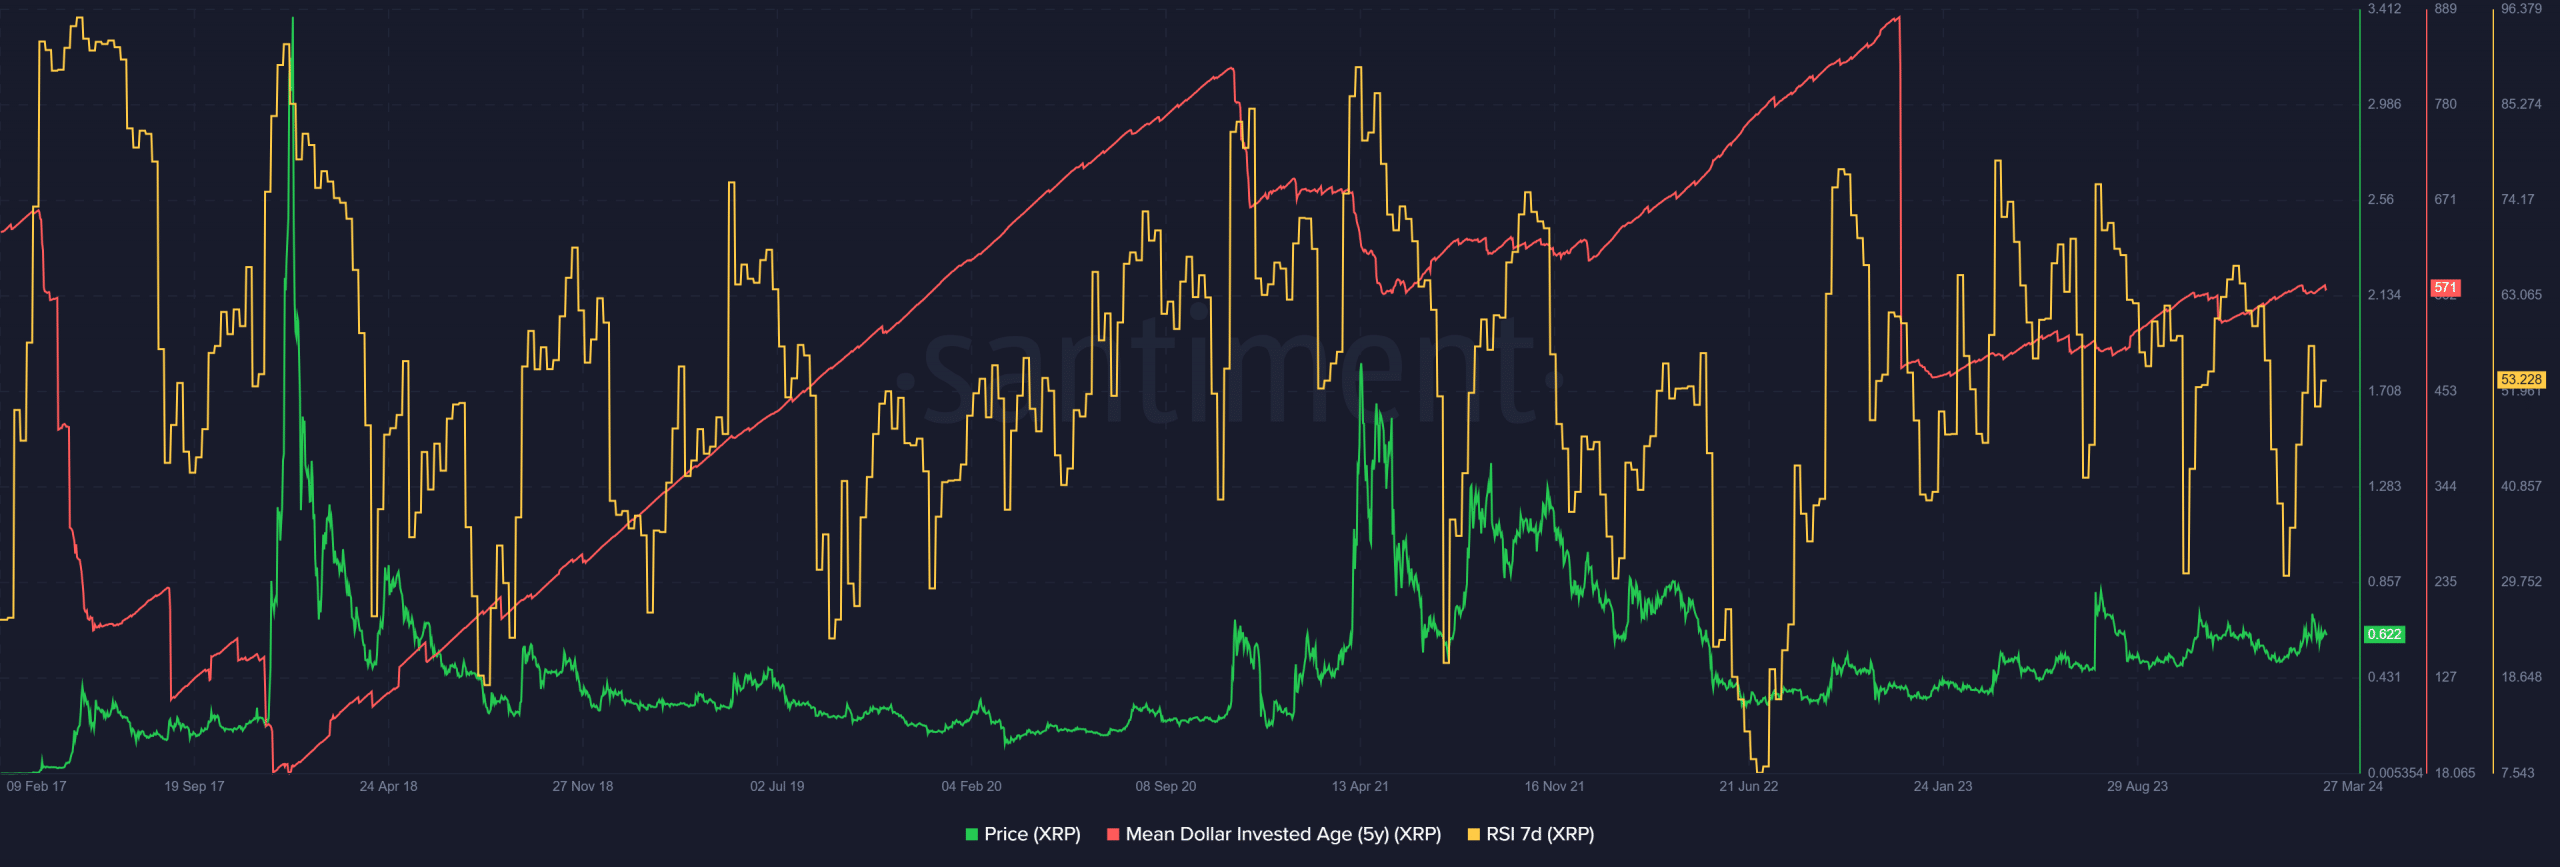
- XRP remained rangebound even as the MDIA fell.
Bitcoin [BTC] was trading at $70.2k at press time, under 5% beneath its all-time high of $73.7k, as ETF inflows had another strong day.
A Santiment post on X (formerly Twitter) noted that previously dormant wallets were getting active and bringing older BTC into circulation.
This behavior is one of the “primary ingredients” for a bull run, Santiment’s tweet said. AMBCrypto used this metric to analyze Cardano [ADA] and Ripple [XRP] to understand whether their bull run has begun too.
Cardano is off the marks
The Mean Dollar Invested Age (MDIA) is the metric that both Santiment and AMBCrypto referred to earlier. It is slightly different from the mean coin age metric.
The difference is that the mean dollar invested age accounts for the purchase price of the dormant BTC (or any other asset).
An uptrend in an asset’s MDIA is considered normal and reflects the coins getting increasingly dormant over time. Holders prefer to hold, which is generally a good thing.
However, when this happens for months at a time or longer, there is some stagnancy in the network. This is concerning because it would make it harder for prices to continue to rise.
When the MDIA falls, it shows previously dormant coins waking up. In the long term, as prices trend higher, investors want to see the MDIA metric trend lower.
The Cardano MDIA (5 years) has been on an uptrend since July 2021. In early March, the metric fell lower as if off a cliff. This was good news for long-term investors.
Less stagnant ADA is generally associated with the beginning of a strong bull run that could last many months.
The last time the MDIA of Cardano maintained a steady downtrend was in July 2020. ADA prices surged from $0.09 to $3.1 before correcting.
During the price’s uptrend, the weekly RSI also formed a series of lower highs. This is technically a bearish divergence, but is not a signal to use for trading during the price discovery phase.
As things stand, this set of lower highs was not present on the weekly RSI.
While XRP investors fret
XRP also saw a downtrend in its MDIA metric from September 2020 to April 2021. This began to reverse and prices trended lower.
This trend strengthened the deeper it got into the bear market, signaling accumulation as prices slid.
Like ADA, XRP also saw a sharp fall in the MDIA. However, this occurred in early December 2023, and the metric has trended higher since.
The precipitous drop not followed by an uptrend could be from profit-taking activity or vast selling pressure from whales.
Is your portfolio green? Check out the ADA Profit Calculator
The MDIA alone is not enough to glean information on exactly where XRP is in the current cycle. Its uptrend since January hinted strongly that an accumulation phase was underway.
XRP remained within a range and was unable to break the $0.7 key resistance level. The uptick in MDIA could be followed by a true bull run in the coming months.


![Cardano [ADA] starts bull run as XRP lags behind – What’s going on?](https://traderfan.io/wp-content/uploads/2024/03/Cardano-XRP-Featured-Image-1-1000x600.webp)

